29
/
en
AIzaSyAYiBZKx7MnpbEhh9jyipgxe19OcubqV5w
April 1, 2024
40316
IDA total
IDA
false
2
1
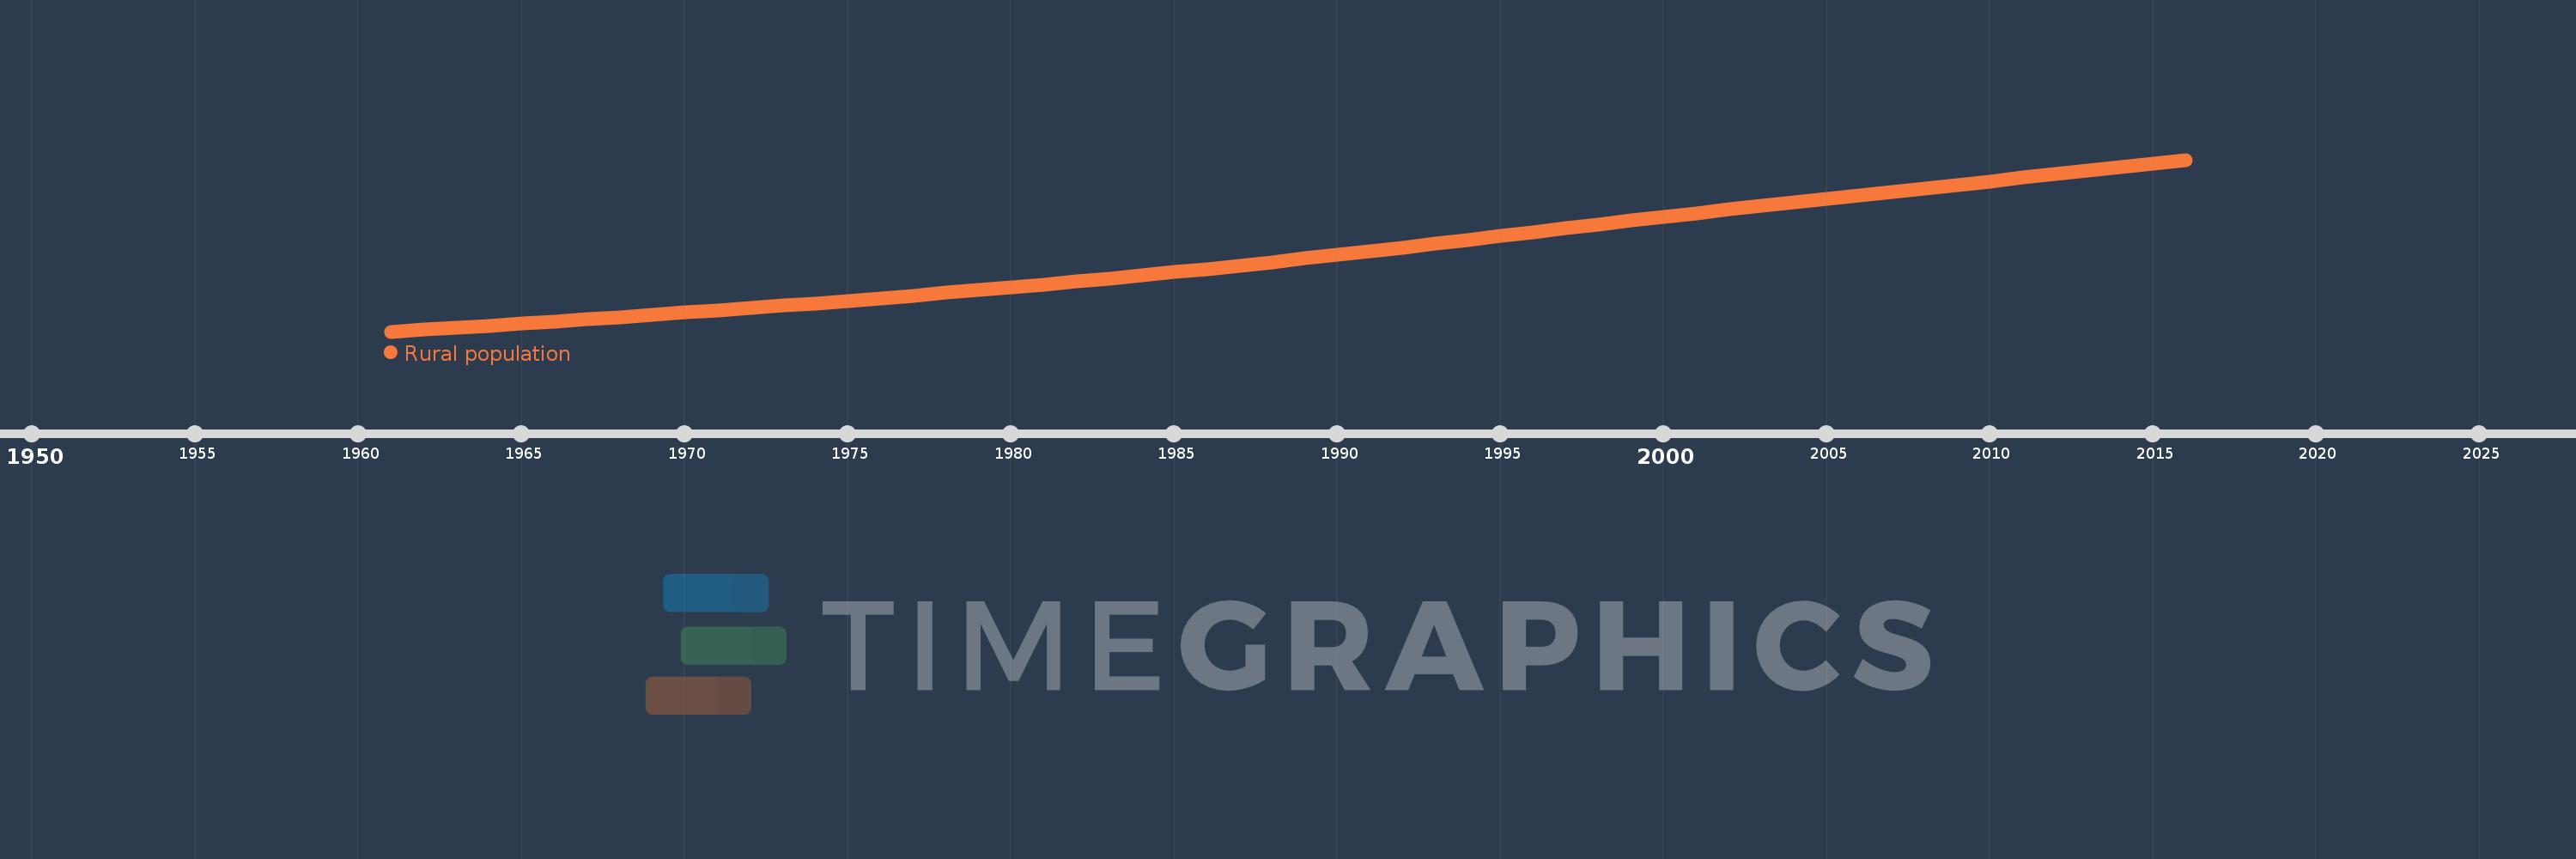
Rural population
2016,2015,2014,2013,2012,2011,2010,2009,2008,2007,2006,2005,2004,2003,2002,2001,2000,1999,1998,1997,1996,1995,1994,1993,1992,1991,1990,1989,1988,1987,1986,1985,1984,1983,1982,1981,1980,1979,1978,1977,1976,1975,1974,1973,1972,1971,1970,1969,1968,1967,1966,1965,1964,1963,1962,1961
This statistics in other country:
AfghanistanAlbaniaAlgeriaAmerican SamoaAndorraAngolaAntigua and BarbudaArab WorldArgentinaArmeniaArubaAustraliaAustriaAzerbaijanBahamas, TheBahrainBangladeshBarbadosBelarusBelgiumBelizeBeninBermudaBhutanBoliviaBosnia and HerzegovinaBotswanaBrazilBritish Virgin IslandsBrunei DarussalamBulgariaBurkina FasoBurundiCabo VerdeCambodiaCameroonCanadaCaribbean small statesCayman IslandsCentral African RepublicCentral Europe and the BalticsChadChannel IslandsChileChinaColombiaComorosCongo, Dem. Rep.Congo, Rep.Costa RicaCote d'IvoireCroatiaCubaCuracaoCyprusCzech RepublicDenmarkDjiboutiDominicaDominican RepublicEarly-demographic dividendEast Asia & PacificEast Asia & Pacific (excluding high income)East Asia & Pacific (IDA & IBRD countries)EcuadorEgypt, Arab Rep.El SalvadorEquatorial GuineaEritreaEstoniaEthiopiaEuro areaEurope & Central AsiaEurope & Central Asia (excluding high income)Europe & Central Asia (IDA & IBRD countries)European UnionFaroe IslandsFijiFinlandFragile and conflict affected situationsFranceFrench PolynesiaGabonGambia, TheGeorgiaGermanyGhanaGibraltarGreeceGreenlandGrenadaGuamGuatemalaGuineaGuinea-BissauGuyanaHaitiHeavily indebted poor countries (HIPC)High incomeHondurasHong Kong SAR, ChinaHungaryIBRD onlyIcelandIDA & IBRD totalIDA blendIDA onlyIDA totalIndiaIndonesiaIran, Islamic Rep.IraqIrelandIsle of ManIsraelItalyJamaicaJapanJordanKazakhstanKenyaKiribatiKorea, Dem. People’s Rep.Korea, Rep.KuwaitKyrgyz RepublicLao PDRLate-demographic dividendLatin America & Caribbean Latin America & Caribbean (excluding high income)Latin America & the Caribbean (IDA & IBRD countries)LatviaLeast developed countries: UN classificationLebanonLesothoLiberiaLibyaLiechtensteinLithuaniaLow & middle incomeLow incomeLower middle incomeLuxembourgMacao SAR, ChinaMacedonia, FYRMadagascarMalawiMalaysiaMaldivesMaliMaltaMarshall IslandsMauritaniaMauritiusMexicoMicronesia, Fed. Sts.Middle East & North AfricaMiddle East & North Africa (excluding high income)Middle East & North Africa (IDA & IBRD countries)Middle incomeMoldovaMonacoMongoliaMontenegroMoroccoMozambiqueMyanmarNamibiaNauruNepalNetherlandsNew CaledoniaNew ZealandNicaraguaNigerNigeriaNorth AmericaNorthern Mariana IslandsNorwayOECD membersOmanOther small statesPacific island small statesPakistanPalauPanamaPapua New GuineaParaguayPeruPhilippinesPolandPortugalPost-demographic dividendPre-demographic dividendPuerto RicoQatarRomaniaRussian FederationRwandaSamoaSan MarinoSao Tome and PrincipeSaudi ArabiaSenegalSerbiaSeychellesSierra LeoneSingaporeSint Maarten (Dutch part)Slovak RepublicSloveniaSmall statesSolomon IslandsSomaliaSouth AfricaSouth AsiaSouth Asia (IDA & IBRD)South SudanSpainSri LankaSt. Kitts and NevisSt. LuciaSt. Vincent and the GrenadinesSub-Saharan Africa Sub-Saharan Africa (excluding high income)Sub-Saharan Africa (IDA & IBRD countries)SudanSurinameSwazilandSwedenSwitzerlandSyrian Arab RepublicTajikistanTanzaniaThailandTimor-LesteTogoTongaTrinidad and TobagoTunisiaTurkeyTurkmenistanTurks and Caicos IslandsTuvaluUgandaUkraineUnited Arab EmiratesUnited KingdomUnited StatesUpper middle incomeUruguayUzbekistanVanuatuVenezuela, RBVietnamVirgin Islands (U.S.)West Bank and GazaWorldYemen, Rep.ZambiaZimbabwe Timeline:
This timeline shows a graph from 1961 to 2016 of IDA total. No data until 1960. Number of actual observations by date: 56.
Source name:
World Development Indicators
Source organization:
The data on urban population shares used to estimate rural population come from the United Nations, World Urbanization Prospects. Total population figures are World Bank estimates.
Categories, topics:
Agriculture & Rural Development
Last updated:
apr 23, 2017
Indicators value changes by year
Minimum:
370.166 mln
jan 1, 1961
Maximum:
1.066 bln
jan 1, 2016
At the date of observation
Value
Absolute change
Change from previous value
jan 1, 1961
370.166 mln
+370.166 mln
0.0%
jan 1, 1962
377.69 mln
+7.523 mln
2.03%
jan 1, 1963
385.472 mln
+7.783 mln
2.06%
jan 1, 1964
393.372 mln
+7.899 mln
2.05%
jan 1, 1965
401.663 mln
+8.291 mln
2.11%
jan 1, 1966
410.183 mln
+8.52 mln
2.12%
jan 1, 1967
419.057 mln
+8.874 mln
2.16%
jan 1, 1968
428.133 mln
+9.076 mln
2.17%
jan 1, 1969
437.413 mln
+9.28 mln
2.17%
jan 1, 1970
446.732 mln
+9.319 mln
2.13%
jan 1, 1971
456.088 mln
+9.356 mln
2.09%
jan 1, 1972
465.319 mln
+9.231 mln
2.02%
jan 1, 1973
474.604 mln
+9.285 mln
2.0%
jan 1, 1974
484.055 mln
+9.451 mln
1.99%
jan 1, 1975
493.725 mln
+9.67 mln
2.0%
jan 1, 1976
505.691 mln
+11.966 mln
2.42%
jan 1, 1977
516.077 mln
+10.387 mln
2.05%
jan 1, 1978
526.77 mln
+10.693 mln
2.07%
jan 1, 1979
537.714 mln
+10.944 mln
2.08%
jan 1, 1980
549.133 mln
+11.418 mln
2.12%
jan 1, 1981
560.651 mln
+11.519 mln
2.1%
jan 1, 1982
572.303 mln
+11.652 mln
2.08%
jan 1, 1983
584.96 mln
+12.657 mln
2.21%
jan 1, 1984
597.784 mln
+12.823 mln
2.19%
jan 1, 1985
610.811 mln
+13.027 mln
2.18%
jan 1, 1986
624.123 mln
+13.312 mln
2.18%
jan 1, 1987
637.878 mln
+13.755 mln
2.2%
jan 1, 1988
651.986 mln
+14.108 mln
2.21%
jan 1, 1989
666.324 mln
+14.338 mln
2.2%
jan 1, 1990
680.922 mln
+14.598 mln
2.19%
jan 1, 1991
695.294 mln
+14.372 mln
2.11%
jan 1, 1992
710.335 mln
+15.042 mln
2.16%
jan 1, 1993
725.699 mln
+15.364 mln
2.16%
jan 1, 1994
741.227 mln
+15.528 mln
2.14%
jan 1, 1995
756.974 mln
+15.747 mln
2.12%
jan 1, 1996
772.692 mln
+15.718 mln
2.08%
jan 1, 1997
788.333 mln
+15.641 mln
2.02%
jan 1, 1998
803.793 mln
+15.46 mln
1.96%
jan 1, 1999
819.221 mln
+15.428 mln
1.92%
jan 1, 2000
834.568 mln
+15.347 mln
1.87%
jan 1, 2001
849.819 mln
+15.251 mln
1.83%
jan 1, 2002
864.435 mln
+14.616 mln
1.72%
jan 1, 2003
878.841 mln
+14.406 mln
1.67%
jan 1, 2004
893.243 mln
+14.402 mln
1.64%
jan 1, 2005
907.652 mln
+14.409 mln
1.61%
jan 1, 2006
921.979 mln
+14.327 mln
1.58%
jan 1, 2007
936.264 mln
+14.285 mln
1.55%
jan 1, 2008
950.527 mln
+14.263 mln
1.52%
jan 1, 2009
964.674 mln
+14.147 mln
1.49%
jan 1, 2010
978.874 mln
+14.199 mln
1.47%
jan 1, 2011
993.325 mln
+14.452 mln
1.48%
jan 1, 2012
1.008 bln
+14.543 mln
1.46%
jan 1, 2013
1.022 bln
+14.393 mln
1.43%
jan 1, 2014
1.037 bln
+14.49 mln
1.42%
jan 1, 2015
1.051 bln
+14.605 mln
1.41%
jan 1, 2016
1.066 bln
+14.662 mln
1.39%
Ranking of countries by current statistics by years


Comments: