29
/
en
AIzaSyAYiBZKx7MnpbEhh9jyipgxe19OcubqV5w
April 1, 2024
282966
Vietnam
VNM
true
2
1
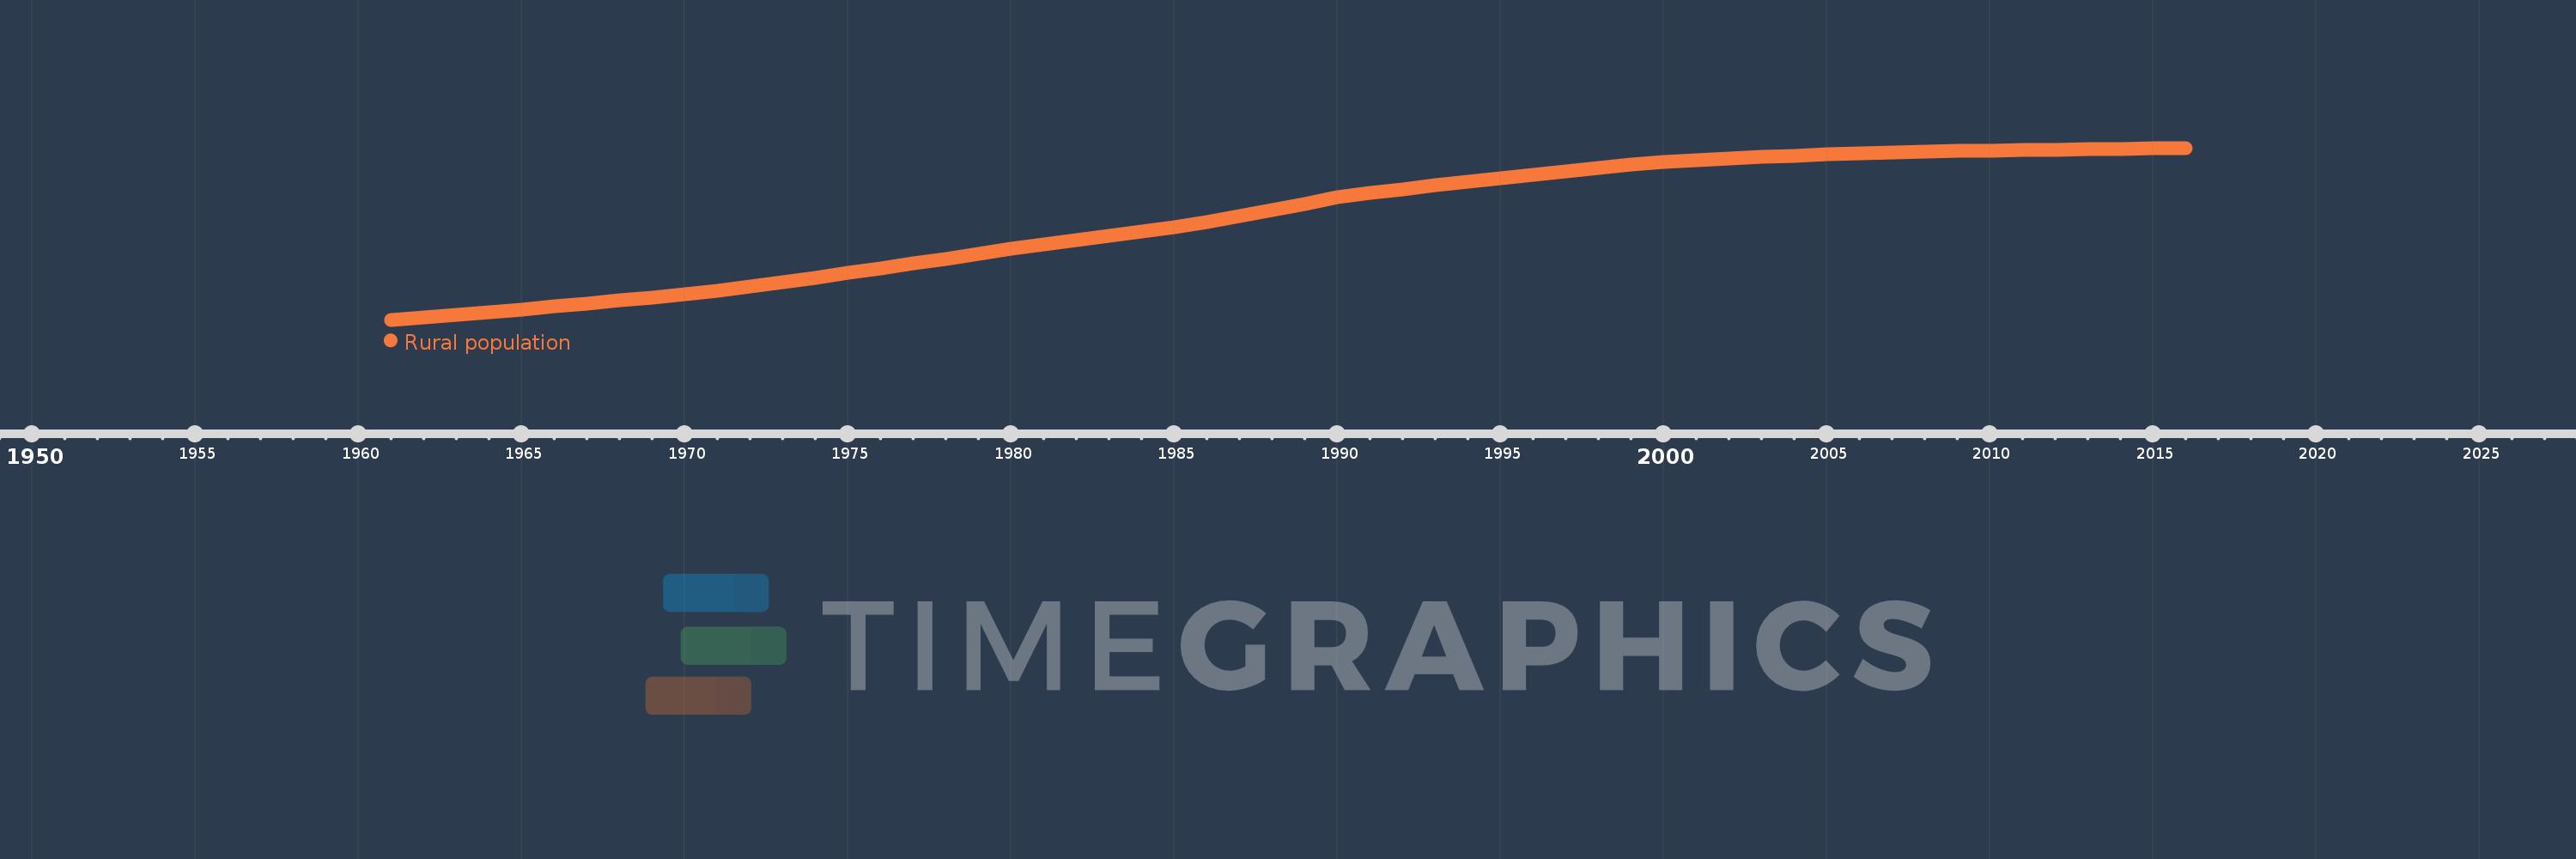
Rural population
2016,2015,2014,2013,2012,2011,2010,2009,2008,2007,2006,2005,2004,2003,2002,2001,2000,1999,1998,1997,1996,1995,1994,1993,1992,1991,1990,1989,1988,1987,1986,1985,1984,1983,1982,1981,1980,1979,1978,1977,1976,1975,1974,1973,1972,1971,1970,1969,1968,1967,1966,1965,1964,1963,1962,1961
This statistics in other country:
AfghanistanAlbaniaAlgeriaAmerican SamoaAndorraAngolaAntigua and BarbudaArab WorldArgentinaArmeniaArubaAustraliaAustriaAzerbaijanBahamas, TheBahrainBangladeshBarbadosBelarusBelgiumBelizeBeninBermudaBhutanBoliviaBosnia and HerzegovinaBotswanaBrazilBritish Virgin IslandsBrunei DarussalamBulgariaBurkina FasoBurundiCabo VerdeCambodiaCameroonCanadaCaribbean small statesCayman IslandsCentral African RepublicCentral Europe and the BalticsChadChannel IslandsChileChinaColombiaComorosCongo, Dem. Rep.Congo, Rep.Costa RicaCote d'IvoireCroatiaCubaCuracaoCyprusCzech RepublicDenmarkDjiboutiDominicaDominican RepublicEarly-demographic dividendEast Asia & PacificEast Asia & Pacific (excluding high income)East Asia & Pacific (IDA & IBRD countries)EcuadorEgypt, Arab Rep.El SalvadorEquatorial GuineaEritreaEstoniaEthiopiaEuro areaEurope & Central AsiaEurope & Central Asia (excluding high income)Europe & Central Asia (IDA & IBRD countries)European UnionFaroe IslandsFijiFinlandFragile and conflict affected situationsFranceFrench PolynesiaGabonGambia, TheGeorgiaGermanyGhanaGibraltarGreeceGreenlandGrenadaGuamGuatemalaGuineaGuinea-BissauGuyanaHaitiHeavily indebted poor countries (HIPC)High incomeHondurasHong Kong SAR, ChinaHungaryIBRD onlyIcelandIDA & IBRD totalIDA blendIDA onlyIDA totalIndiaIndonesiaIran, Islamic Rep.IraqIrelandIsle of ManIsraelItalyJamaicaJapanJordanKazakhstanKenyaKiribatiKorea, Dem. People’s Rep.Korea, Rep.KuwaitKyrgyz RepublicLao PDRLate-demographic dividendLatin America & Caribbean Latin America & Caribbean (excluding high income)Latin America & the Caribbean (IDA & IBRD countries)LatviaLeast developed countries: UN classificationLebanonLesothoLiberiaLibyaLiechtensteinLithuaniaLow & middle incomeLow incomeLower middle incomeLuxembourgMacao SAR, ChinaMacedonia, FYRMadagascarMalawiMalaysiaMaldivesMaliMaltaMarshall IslandsMauritaniaMauritiusMexicoMicronesia, Fed. Sts.Middle East & North AfricaMiddle East & North Africa (excluding high income)Middle East & North Africa (IDA & IBRD countries)Middle incomeMoldovaMonacoMongoliaMontenegroMoroccoMozambiqueMyanmarNamibiaNauruNepalNetherlandsNew CaledoniaNew ZealandNicaraguaNigerNigeriaNorth AmericaNorthern Mariana IslandsNorwayOECD membersOmanOther small statesPacific island small statesPakistanPalauPanamaPapua New GuineaParaguayPeruPhilippinesPolandPortugalPost-demographic dividendPre-demographic dividendPuerto RicoQatarRomaniaRussian FederationRwandaSamoaSan MarinoSao Tome and PrincipeSaudi ArabiaSenegalSerbiaSeychellesSierra LeoneSingaporeSint Maarten (Dutch part)Slovak RepublicSloveniaSmall statesSolomon IslandsSomaliaSouth AfricaSouth AsiaSouth Asia (IDA & IBRD)South SudanSpainSri LankaSt. Kitts and NevisSt. LuciaSt. Vincent and the GrenadinesSub-Saharan Africa Sub-Saharan Africa (excluding high income)Sub-Saharan Africa (IDA & IBRD countries)SudanSurinameSwazilandSwedenSwitzerlandSyrian Arab RepublicTajikistanTanzaniaThailandTimor-LesteTogoTongaTrinidad and TobagoTunisiaTurkeyTurkmenistanTurks and Caicos IslandsTuvaluUgandaUkraineUnited Arab EmiratesUnited KingdomUnited StatesUpper middle incomeUruguayUzbekistanVanuatuVenezuela, RBVietnamVirgin Islands (U.S.)West Bank and GazaWorldYemen, Rep.ZambiaZimbabwe Timeline:
This timeline shows a graph from 1961 to 2016 of Vietnam. No data until 1960. Number of actual observations by date: 56.
Source name:
World Development Indicators
Source organization:
The data on urban population shares used to estimate rural population come from the United Nations, World Urbanization Prospects. Total population figures are World Bank estimates.
Categories, topics:
Agriculture & Rural Development
Last updated:
apr 23, 2017
Indicators value changes by year
Minimum:
29.636 mln
jan 1, 1961
Maximum:
60.898 mln
jan 1, 2016
At the date of observation
Value
Absolute change
Change from previous value
jan 1, 1961
29.636 mln
+29.636 mln
0.0%
jan 1, 1962
30.103 mln
+467.038K
1.58%
jan 1, 1963
30.571 mln
+468.439K
1.56%
jan 1, 1964
31.048 mln
+476.335K
1.56%
jan 1, 1965
31.538 mln
+490.522K
1.58%
jan 1, 1966
32.045 mln
+506.911K
1.61%
jan 1, 1967
32.572 mln
+527.383K
1.65%
jan 1, 1968
33.122 mln
+549.824K
1.69%
jan 1, 1969
33.694 mln
+572.121K
1.73%
jan 1, 1970
34.291 mln
+596.686K
1.77%
jan 1, 1971
34.91 mln
+618.555K
1.8%
jan 1, 1972
35.681 mln
+771.756K
2.21%
jan 1, 1973
36.481 mln
+800.002K
2.24%
jan 1, 1974
37.307 mln
+825.698K
2.26%
jan 1, 1975
38.151 mln
+844.323K
2.26%
jan 1, 1976
39.009 mln
+857.633K
2.25%
jan 1, 1977
39.877 mln
+867.965K
2.23%
jan 1, 1978
40.75 mln
+873.045K
2.19%
jan 1, 1979
41.624 mln
+874.054K
2.14%
jan 1, 1980
42.493 mln
+868.866K
2.09%
jan 1, 1981
43.364 mln
+871.426K
2.05%
jan 1, 1982
44.156 mln
+791.368K
1.82%
jan 1, 1983
44.899 mln
+743.585K
1.68%
jan 1, 1984
45.644 mln
+744.787K
1.66%
jan 1, 1985
46.443 mln
+799.113K
1.75%
jan 1, 1986
47.353 mln
+909.617K
1.96%
jan 1, 1987
48.425 mln
+1.072 mln
2.26%
jan 1, 1988
49.593 mln
+1.168 mln
2.41%
jan 1, 1989
50.767 mln
+1.175 mln
2.37%
jan 1, 1990
51.89 mln
+1.123 mln
2.21%
jan 1, 1991
52.645 mln
+754.566K
1.45%
jan 1, 1992
53.374 mln
+728.638K
1.38%
jan 1, 1993
54.076 mln
+701.924K
1.32%
jan 1, 1994
54.743 mln
+667.087K
1.23%
jan 1, 1995
55.385 mln
+642.093K
1.17%
jan 1, 1996
56.022 mln
+637.099K
1.15%
jan 1, 1997
56.639 mln
+616.791K
1.1%
jan 1, 1998
57.236 mln
+596.984K
1.05%
jan 1, 1999
57.818 mln
+582.002K
1.02%
jan 1, 2000
58.354 mln
+536.029K
0.93%
jan 1, 2001
58.709 mln
+355.48K
0.61%
jan 1, 2002
59.015 mln
+305.762K
0.52%
jan 1, 2003
59.247 mln
+231.931K
0.39%
jan 1, 2004
59.472 mln
+225.009K
0.38%
jan 1, 2005
59.707 mln
+234.879K
0.39%
jan 1, 2006
59.915 mln
+207.986K
0.35%
jan 1, 2007
60.077 mln
+162.662K
0.27%
jan 1, 2008
60.213 mln
+135.486K
0.23%
jan 1, 2009
60.325 mln
+112.466K
0.19%
jan 1, 2010
60.426 mln
+100.355K
0.17%
jan 1, 2011
60.512 mln
+86.295K
0.14%
jan 1, 2012
60.598 mln
+86.153K
0.14%
jan 1, 2013
60.685 mln
+86.975K
0.14%
jan 1, 2014
60.759 mln
+74.0K
0.12%
jan 1, 2015
60.833 mln
+73.717K
0.12%
jan 1, 2016
60.898 mln
+64.922K
0.11%
Ranking of countries by current statistics by years


Comments: