29
/
en
AIzaSyAYiBZKx7MnpbEhh9jyipgxe19OcubqV5w
April 1, 2024
159862
Ireland
IRL
true
2
1
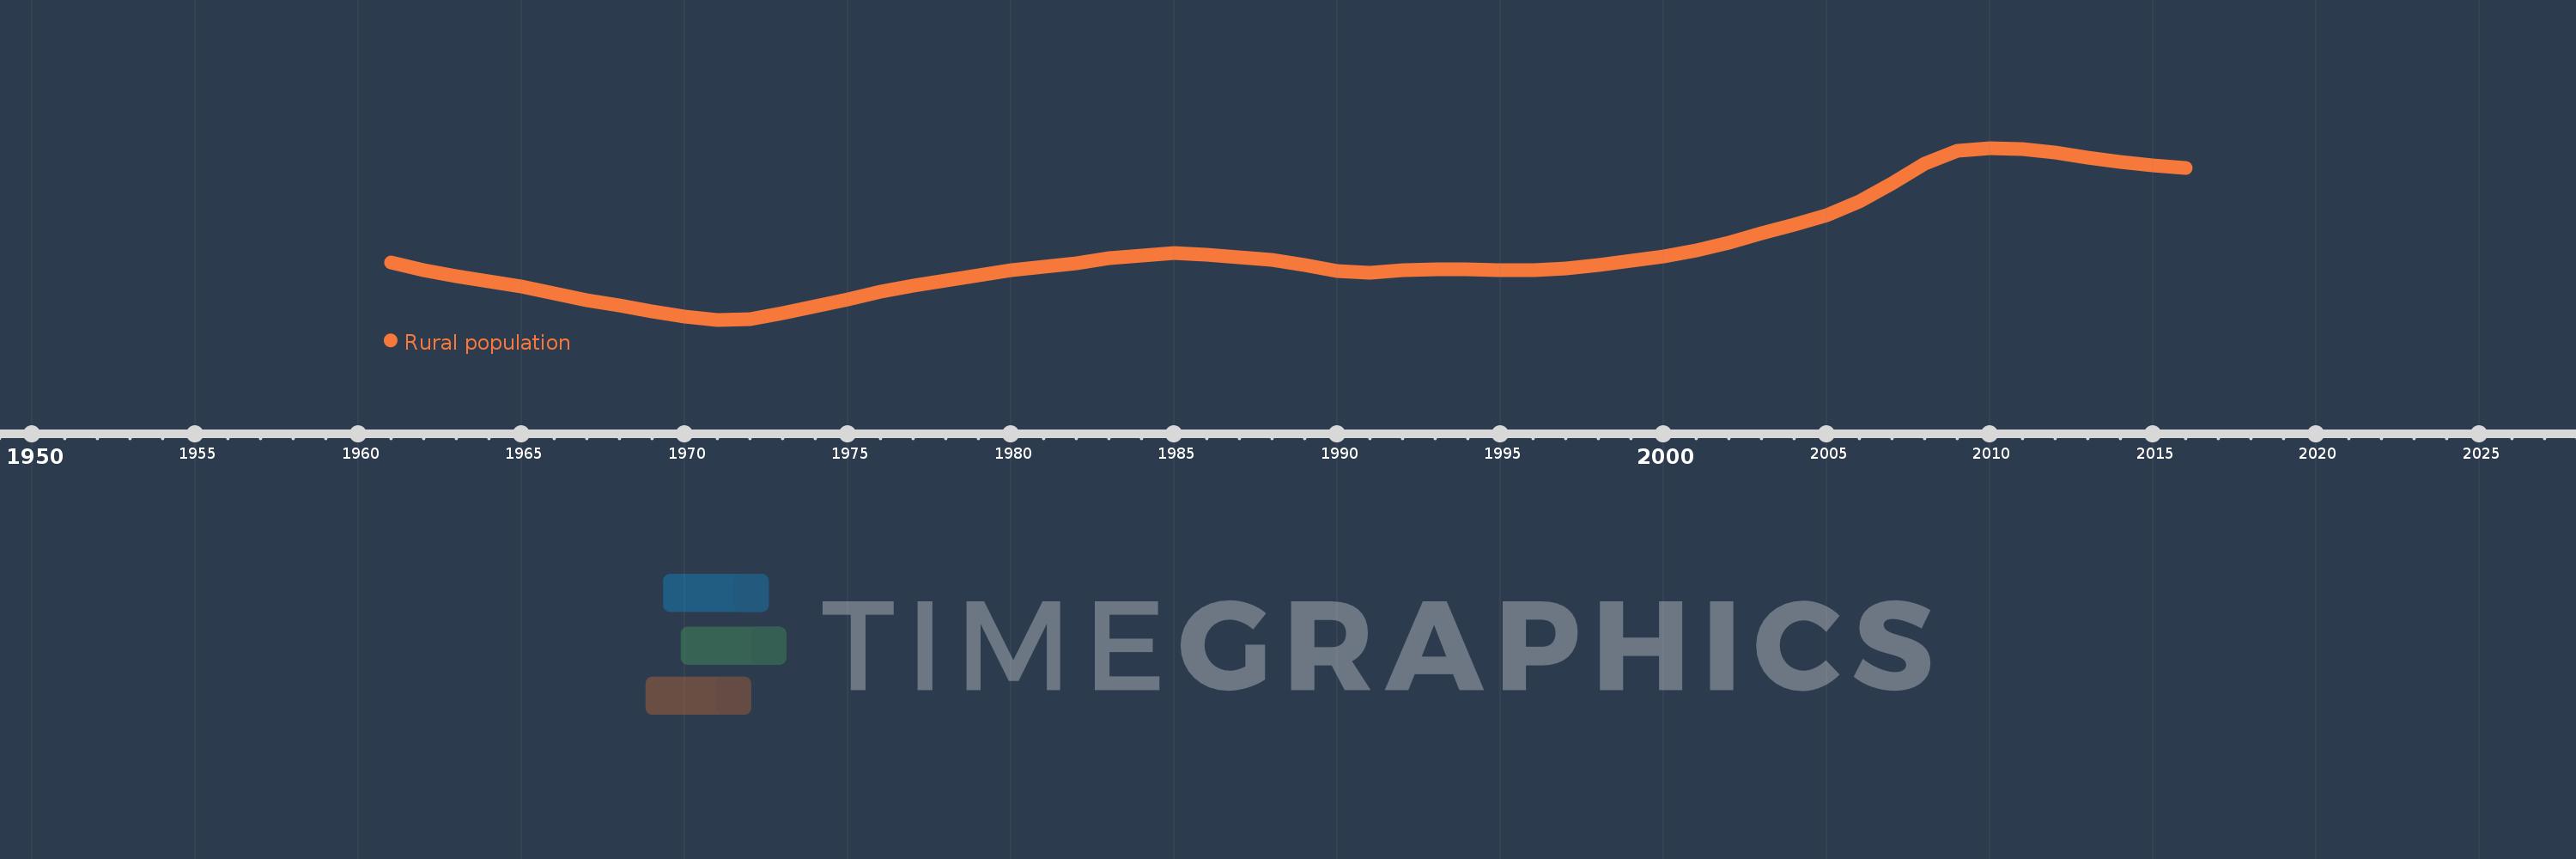
Rural population
2016,2015,2014,2013,2012,2011,2010,2009,2008,2007,2006,2005,2004,2003,2002,2001,2000,1999,1998,1997,1996,1995,1994,1993,1992,1991,1990,1989,1988,1987,1986,1985,1984,1983,1982,1981,1980,1979,1978,1977,1976,1975,1974,1973,1972,1971,1970,1969,1968,1967,1966,1965,1964,1963,1962,1961
This statistics in other country:
AfghanistanAlbaniaAlgeriaAmerican SamoaAndorraAngolaAntigua and BarbudaArab WorldArgentinaArmeniaArubaAustraliaAustriaAzerbaijanBahamas, TheBahrainBangladeshBarbadosBelarusBelgiumBelizeBeninBermudaBhutanBoliviaBosnia and HerzegovinaBotswanaBrazilBritish Virgin IslandsBrunei DarussalamBulgariaBurkina FasoBurundiCabo VerdeCambodiaCameroonCanadaCaribbean small statesCayman IslandsCentral African RepublicCentral Europe and the BalticsChadChannel IslandsChileChinaColombiaComorosCongo, Dem. Rep.Congo, Rep.Costa RicaCote d'IvoireCroatiaCubaCuracaoCyprusCzech RepublicDenmarkDjiboutiDominicaDominican RepublicEarly-demographic dividendEast Asia & PacificEast Asia & Pacific (excluding high income)East Asia & Pacific (IDA & IBRD countries)EcuadorEgypt, Arab Rep.El SalvadorEquatorial GuineaEritreaEstoniaEthiopiaEuro areaEurope & Central AsiaEurope & Central Asia (excluding high income)Europe & Central Asia (IDA & IBRD countries)European UnionFaroe IslandsFijiFinlandFragile and conflict affected situationsFranceFrench PolynesiaGabonGambia, TheGeorgiaGermanyGhanaGibraltarGreeceGreenlandGrenadaGuamGuatemalaGuineaGuinea-BissauGuyanaHaitiHeavily indebted poor countries (HIPC)High incomeHondurasHong Kong SAR, ChinaHungaryIBRD onlyIcelandIDA & IBRD totalIDA blendIDA onlyIDA totalIndiaIndonesiaIran, Islamic Rep.IraqIrelandIsle of ManIsraelItalyJamaicaJapanJordanKazakhstanKenyaKiribatiKorea, Dem. People’s Rep.Korea, Rep.KuwaitKyrgyz RepublicLao PDRLate-demographic dividendLatin America & Caribbean Latin America & Caribbean (excluding high income)Latin America & the Caribbean (IDA & IBRD countries)LatviaLeast developed countries: UN classificationLebanonLesothoLiberiaLibyaLiechtensteinLithuaniaLow & middle incomeLow incomeLower middle incomeLuxembourgMacao SAR, ChinaMacedonia, FYRMadagascarMalawiMalaysiaMaldivesMaliMaltaMarshall IslandsMauritaniaMauritiusMexicoMicronesia, Fed. Sts.Middle East & North AfricaMiddle East & North Africa (excluding high income)Middle East & North Africa (IDA & IBRD countries)Middle incomeMoldovaMonacoMongoliaMontenegroMoroccoMozambiqueMyanmarNamibiaNauruNepalNetherlandsNew CaledoniaNew ZealandNicaraguaNigerNigeriaNorth AmericaNorthern Mariana IslandsNorwayOECD membersOmanOther small statesPacific island small statesPakistanPalauPanamaPapua New GuineaParaguayPeruPhilippinesPolandPortugalPost-demographic dividendPre-demographic dividendPuerto RicoQatarRomaniaRussian FederationRwandaSamoaSan MarinoSao Tome and PrincipeSaudi ArabiaSenegalSerbiaSeychellesSierra LeoneSingaporeSint Maarten (Dutch part)Slovak RepublicSloveniaSmall statesSolomon IslandsSomaliaSouth AfricaSouth AsiaSouth Asia (IDA & IBRD)South SudanSpainSri LankaSt. Kitts and NevisSt. LuciaSt. Vincent and the GrenadinesSub-Saharan Africa Sub-Saharan Africa (excluding high income)Sub-Saharan Africa (IDA & IBRD countries)SudanSurinameSwazilandSwedenSwitzerlandSyrian Arab RepublicTajikistanTanzaniaThailandTimor-LesteTogoTongaTrinidad and TobagoTunisiaTurkeyTurkmenistanTurks and Caicos IslandsTuvaluUgandaUkraineUnited Arab EmiratesUnited KingdomUnited StatesUpper middle incomeUruguayUzbekistanVanuatuVenezuela, RBVietnamVirgin Islands (U.S.)West Bank and GazaWorldYemen, Rep.ZambiaZimbabwe Timeline:
This timeline shows a graph from 1961 to 2016 of Ireland. No data until 1960. Number of actual observations by date: 56.
Source name:
World Development Indicators
Source organization:
The data on urban population shares used to estimate rural population come from the United Nations, World Urbanization Prospects. Total population figures are World Bank estimates.
Categories, topics:
Agriculture & Rural Development
Last updated:
apr 23, 2017
Indicators value changes by year
Minimum:
1.428 mln
jan 1, 1971
Maximum:
1.743 mln
jan 1, 2010
At the date of observation
Value
Absolute change
Change from previous value
jan 1, 1961
1.532 mln
+1.532 mln
0.0%
jan 1, 1962
1.518 mln
-14.082K
-0.92%
jan 1, 1963
1.507 mln
-11.207K
-0.74%
jan 1, 1964
1.498 mln
-8.779K
-0.58%
jan 1, 1965
1.488 mln
-10.414K
-0.7%
jan 1, 1966
1.476 mln
-12.201K
-0.82%
jan 1, 1967
1.464 mln
-11.839K
-0.8%
jan 1, 1968
1.453 mln
-10.497K
-0.72%
jan 1, 1969
1.442 mln
-10.962K
-0.75%
jan 1, 1970
1.433 mln
-9.107K
-0.63%
jan 1, 1971
1.428 mln
-5.69K
-0.4%
jan 1, 1972
1.428 mln
+434.0
0.03%
jan 1, 1973
1.439 mln
+10.998K
0.77%
jan 1, 1974
1.452 mln
+12.745K
0.89%
jan 1, 1975
1.465 mln
+13.523K
0.93%
jan 1, 1976
1.479 mln
+13.466K
0.92%
jan 1, 1977
1.49 mln
+11.446K
0.77%
jan 1, 1978
1.499 mln
+9.16K
0.61%
jan 1, 1979
1.51 mln
+10.107K
0.67%
jan 1, 1980
1.518 mln
+8.81K
0.58%
jan 1, 1981
1.524 mln
+6.005K
0.4%
jan 1, 1982
1.532 mln
+7.563K
0.5%
jan 1, 1983
1.541 mln
+8.975K
0.59%
jan 1, 1984
1.546 mln
+5.311K
0.34%
jan 1, 1985
1.55 mln
+3.96K
0.26%
jan 1, 1986
1.547 mln
-3.178K
-0.21%
jan 1, 1987
1.542 mln
-4.641K
-0.3%
jan 1, 1988
1.538 mln
-4.089K
-0.27%
jan 1, 1989
1.528 mln
-10.795K
-0.7%
jan 1, 1990
1.517 mln
-10.254K
-0.67%
jan 1, 1991
1.514 mln
-2.935K
-0.19%
jan 1, 1992
1.518 mln
+3.783K
0.25%
jan 1, 1993
1.521 mln
+2.6K
0.17%
jan 1, 1994
1.52 mln
-212.0
-0.01%
jan 1, 1995
1.519 mln
-1.822K
-0.12%
jan 1, 1996
1.519 mln
-61.0
0.0%
jan 1, 1997
1.523 mln
+3.916K
0.26%
jan 1, 1998
1.529 mln
+6.123K
0.4%
jan 1, 1999
1.535 mln
+6.746K
0.44%
jan 1, 2000
1.543 mln
+7.982K
0.52%
jan 1, 2001
1.555 mln
+11.199K
0.73%
jan 1, 2002
1.57 mln
+15.322K
0.99%
jan 1, 2003
1.587 mln
+16.692K
1.06%
jan 1, 2004
1.602 mln
+15.026K
0.95%
jan 1, 2005
1.62 mln
+18.277K
1.14%
jan 1, 2006
1.644 mln
+24.24K
1.5%
jan 1, 2007
1.677 mln
+33.176K
2.02%
jan 1, 2008
1.714 mln
+37.189K
2.22%
jan 1, 2009
1.738 mln
+23.055K
1.34%
jan 1, 2010
1.743 mln
+5.447K
0.31%
jan 1, 2011
1.74 mln
-2.835K
-0.16%
jan 1, 2012
1.734 mln
-6.054K
-0.35%
jan 1, 2013
1.725 mln
-8.786K
-0.51%
jan 1, 2014
1.717 mln
-8.634K
-0.5%
jan 1, 2015
1.711 mln
-6.091K
-0.35%
jan 1, 2016
1.706 mln
-4.714K
-0.28%
Ranking of countries by current statistics by years


Comments: