29
/
en
AIzaSyAYiBZKx7MnpbEhh9jyipgxe19OcubqV5w
April 1, 2024
287881
Zimbabwe
ZWE
true
2
1
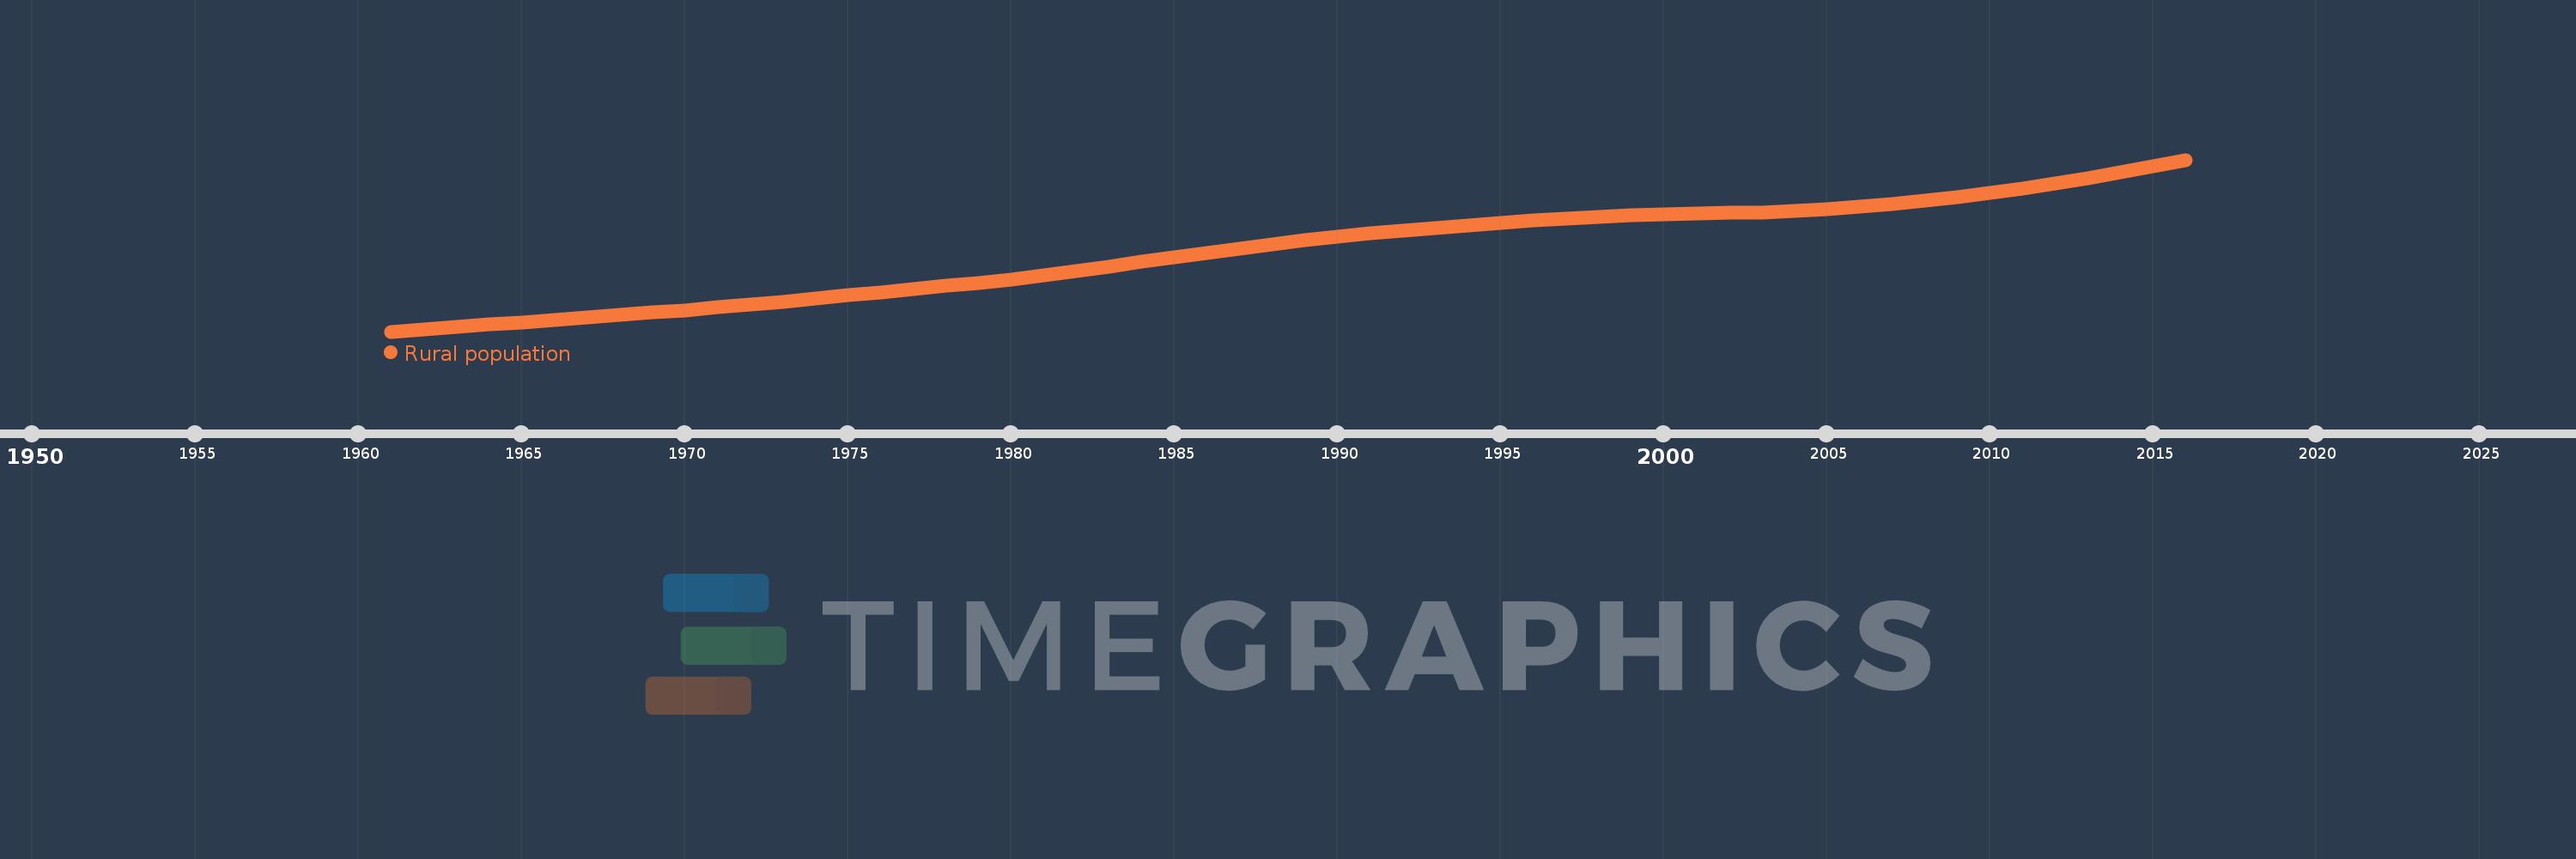
Rural population
2016,2015,2014,2013,2012,2011,2010,2009,2008,2007,2006,2005,2004,2003,2002,2001,2000,1999,1998,1997,1996,1995,1994,1993,1992,1991,1990,1989,1988,1987,1986,1985,1984,1983,1982,1981,1980,1979,1978,1977,1976,1975,1974,1973,1972,1971,1970,1969,1968,1967,1966,1965,1964,1963,1962,1961
This statistics in other country:
AfghanistanAlbaniaAlgeriaAmerican SamoaAndorraAngolaAntigua and BarbudaArab WorldArgentinaArmeniaArubaAustraliaAustriaAzerbaijanBahamas, TheBahrainBangladeshBarbadosBelarusBelgiumBelizeBeninBermudaBhutanBoliviaBosnia and HerzegovinaBotswanaBrazilBritish Virgin IslandsBrunei DarussalamBulgariaBurkina FasoBurundiCabo VerdeCambodiaCameroonCanadaCaribbean small statesCayman IslandsCentral African RepublicCentral Europe and the BalticsChadChannel IslandsChileChinaColombiaComorosCongo, Dem. Rep.Congo, Rep.Costa RicaCote d'IvoireCroatiaCubaCuracaoCyprusCzech RepublicDenmarkDjiboutiDominicaDominican RepublicEarly-demographic dividendEast Asia & PacificEast Asia & Pacific (excluding high income)East Asia & Pacific (IDA & IBRD countries)EcuadorEgypt, Arab Rep.El SalvadorEquatorial GuineaEritreaEstoniaEthiopiaEuro areaEurope & Central AsiaEurope & Central Asia (excluding high income)Europe & Central Asia (IDA & IBRD countries)European UnionFaroe IslandsFijiFinlandFragile and conflict affected situationsFranceFrench PolynesiaGabonGambia, TheGeorgiaGermanyGhanaGibraltarGreeceGreenlandGrenadaGuamGuatemalaGuineaGuinea-BissauGuyanaHaitiHeavily indebted poor countries (HIPC)High incomeHondurasHong Kong SAR, ChinaHungaryIBRD onlyIcelandIDA & IBRD totalIDA blendIDA onlyIDA totalIndiaIndonesiaIran, Islamic Rep.IraqIrelandIsle of ManIsraelItalyJamaicaJapanJordanKazakhstanKenyaKiribatiKorea, Dem. People’s Rep.Korea, Rep.KuwaitKyrgyz RepublicLao PDRLate-demographic dividendLatin America & Caribbean Latin America & Caribbean (excluding high income)Latin America & the Caribbean (IDA & IBRD countries)LatviaLeast developed countries: UN classificationLebanonLesothoLiberiaLibyaLiechtensteinLithuaniaLow & middle incomeLow incomeLower middle incomeLuxembourgMacao SAR, ChinaMacedonia, FYRMadagascarMalawiMalaysiaMaldivesMaliMaltaMarshall IslandsMauritaniaMauritiusMexicoMicronesia, Fed. Sts.Middle East & North AfricaMiddle East & North Africa (excluding high income)Middle East & North Africa (IDA & IBRD countries)Middle incomeMoldovaMonacoMongoliaMontenegroMoroccoMozambiqueMyanmarNamibiaNauruNepalNetherlandsNew CaledoniaNew ZealandNicaraguaNigerNigeriaNorth AmericaNorthern Mariana IslandsNorwayOECD membersOmanOther small statesPacific island small statesPakistanPalauPanamaPapua New GuineaParaguayPeruPhilippinesPolandPortugalPost-demographic dividendPre-demographic dividendPuerto RicoQatarRomaniaRussian FederationRwandaSamoaSan MarinoSao Tome and PrincipeSaudi ArabiaSenegalSerbiaSeychellesSierra LeoneSingaporeSint Maarten (Dutch part)Slovak RepublicSloveniaSmall statesSolomon IslandsSomaliaSouth AfricaSouth AsiaSouth Asia (IDA & IBRD)South SudanSpainSri LankaSt. Kitts and NevisSt. LuciaSt. Vincent and the GrenadinesSub-Saharan Africa Sub-Saharan Africa (excluding high income)Sub-Saharan Africa (IDA & IBRD countries)SudanSurinameSwazilandSwedenSwitzerlandSyrian Arab RepublicTajikistanTanzaniaThailandTimor-LesteTogoTongaTrinidad and TobagoTunisiaTurkeyTurkmenistanTurks and Caicos IslandsTuvaluUgandaUkraineUnited Arab EmiratesUnited KingdomUnited StatesUpper middle incomeUruguayUzbekistanVanuatuVenezuela, RBVietnamVirgin Islands (U.S.)West Bank and GazaWorldYemen, Rep.ZambiaZimbabwe Timeline:
This timeline shows a graph from 1961 to 2016 of Zimbabwe. No data until 1960. Number of actual observations by date: 56.
Source name:
World Development Indicators
Source organization:
The data on urban population shares used to estimate rural population come from the United Nations, World Urbanization Prospects. Total population figures are World Bank estimates.
Categories, topics:
Agriculture & Rural Development
Last updated:
apr 23, 2017
Indicators value changes by year
Minimum:
3.279 mln
jan 1, 1961
Maximum:
10.551 mln
jan 1, 2016
At the date of observation
Value
Absolute change
Change from previous value
jan 1, 1961
3.279 mln
+3.279 mln
0.0%
jan 1, 1962
3.38 mln
+100.325K
3.06%
jan 1, 1963
3.482 mln
+102.549K
3.03%
jan 1, 1964
3.579 mln
+96.403K
2.77%
jan 1, 1965
3.676 mln
+97.919K
2.74%
jan 1, 1966
3.776 mln
+99.131K
2.7%
jan 1, 1967
3.876 mln
+99.918K
2.65%
jan 1, 1968
3.977 mln
+100.982K
2.61%
jan 1, 1969
4.079 mln
+102.824K
2.59%
jan 1, 1970
4.186 mln
+106.85K
2.62%
jan 1, 1971
4.302 mln
+116.201K
2.78%
jan 1, 1972
4.424 mln
+121.398K
2.82%
jan 1, 1973
4.55 mln
+126.263K
2.85%
jan 1, 1974
4.68 mln
+129.606K
2.85%
jan 1, 1975
4.81 mln
+130.438K
2.79%
jan 1, 1976
4.944 mln
+133.967K
2.79%
jan 1, 1977
5.076 mln
+132.411K
2.68%
jan 1, 1978
5.209 mln
+132.444K
2.61%
jan 1, 1979
5.346 mln
+137.22K
2.63%
jan 1, 1980
5.495 mln
+148.502K
2.78%
jan 1, 1981
5.658 mln
+163.802K
2.98%
jan 1, 1982
5.838 mln
+179.922K
3.18%
jan 1, 1983
6.031 mln
+192.685K
3.3%
jan 1, 1984
6.224 mln
+193.443K
3.21%
jan 1, 1985
6.419 mln
+194.269K
3.12%
jan 1, 1986
6.61 mln
+191.499K
2.98%
jan 1, 1987
6.798 mln
+187.248K
2.83%
jan 1, 1988
6.979 mln
+181.735K
2.67%
jan 1, 1989
7.151 mln
+171.802K
2.46%
jan 1, 1990
7.308 mln
+156.668K
2.19%
jan 1, 1991
7.445 mln
+137.733K
1.88%
jan 1, 1992
7.562 mln
+116.878K
1.57%
jan 1, 1993
7.659 mln
+96.49K
1.28%
jan 1, 1994
7.774 mln
+114.933K
1.5%
jan 1, 1995
7.881 mln
+106.803K
1.37%
jan 1, 1996
7.976 mln
+95.293K
1.21%
jan 1, 1997
8.061 mln
+85.29K
1.07%
jan 1, 1998
8.136 mln
+75.171K
0.93%
jan 1, 1999
8.199 mln
+63.071K
0.78%
jan 1, 2000
8.248 mln
+48.28K
0.59%
jan 1, 2001
8.28 mln
+32.582K
0.4%
jan 1, 2002
8.297 mln
+16.968K
0.2%
jan 1, 2003
8.302 mln
+4.895K
0.06%
jan 1, 2004
8.37 mln
+67.659K
0.81%
jan 1, 2005
8.455 mln
+85.176K
1.02%
jan 1, 2006
8.555 mln
+100.498K
1.19%
jan 1, 2007
8.674 mln
+118.723K
1.39%
jan 1, 2008
8.811 mln
+136.566K
1.57%
jan 1, 2009
8.966 mln
+155.663K
1.77%
jan 1, 2010
9.141 mln
+174.818K
1.95%
jan 1, 2011
9.335 mln
+193.919K
2.12%
jan 1, 2012
9.549 mln
+213.986K
2.29%
jan 1, 2013
9.783 mln
+233.944K
2.45%
jan 1, 2014
10.033 mln
+250.217K
2.56%
jan 1, 2015
10.291 mln
+257.531K
2.57%
jan 1, 2016
10.551 mln
+260.404K
2.53%
Ranking of countries by current statistics by years


Comments: