29
/
en
AIzaSyAYiBZKx7MnpbEhh9jyipgxe19OcubqV5w
April 1, 2024
111592
Congo, Rep.
COG
true
2
1
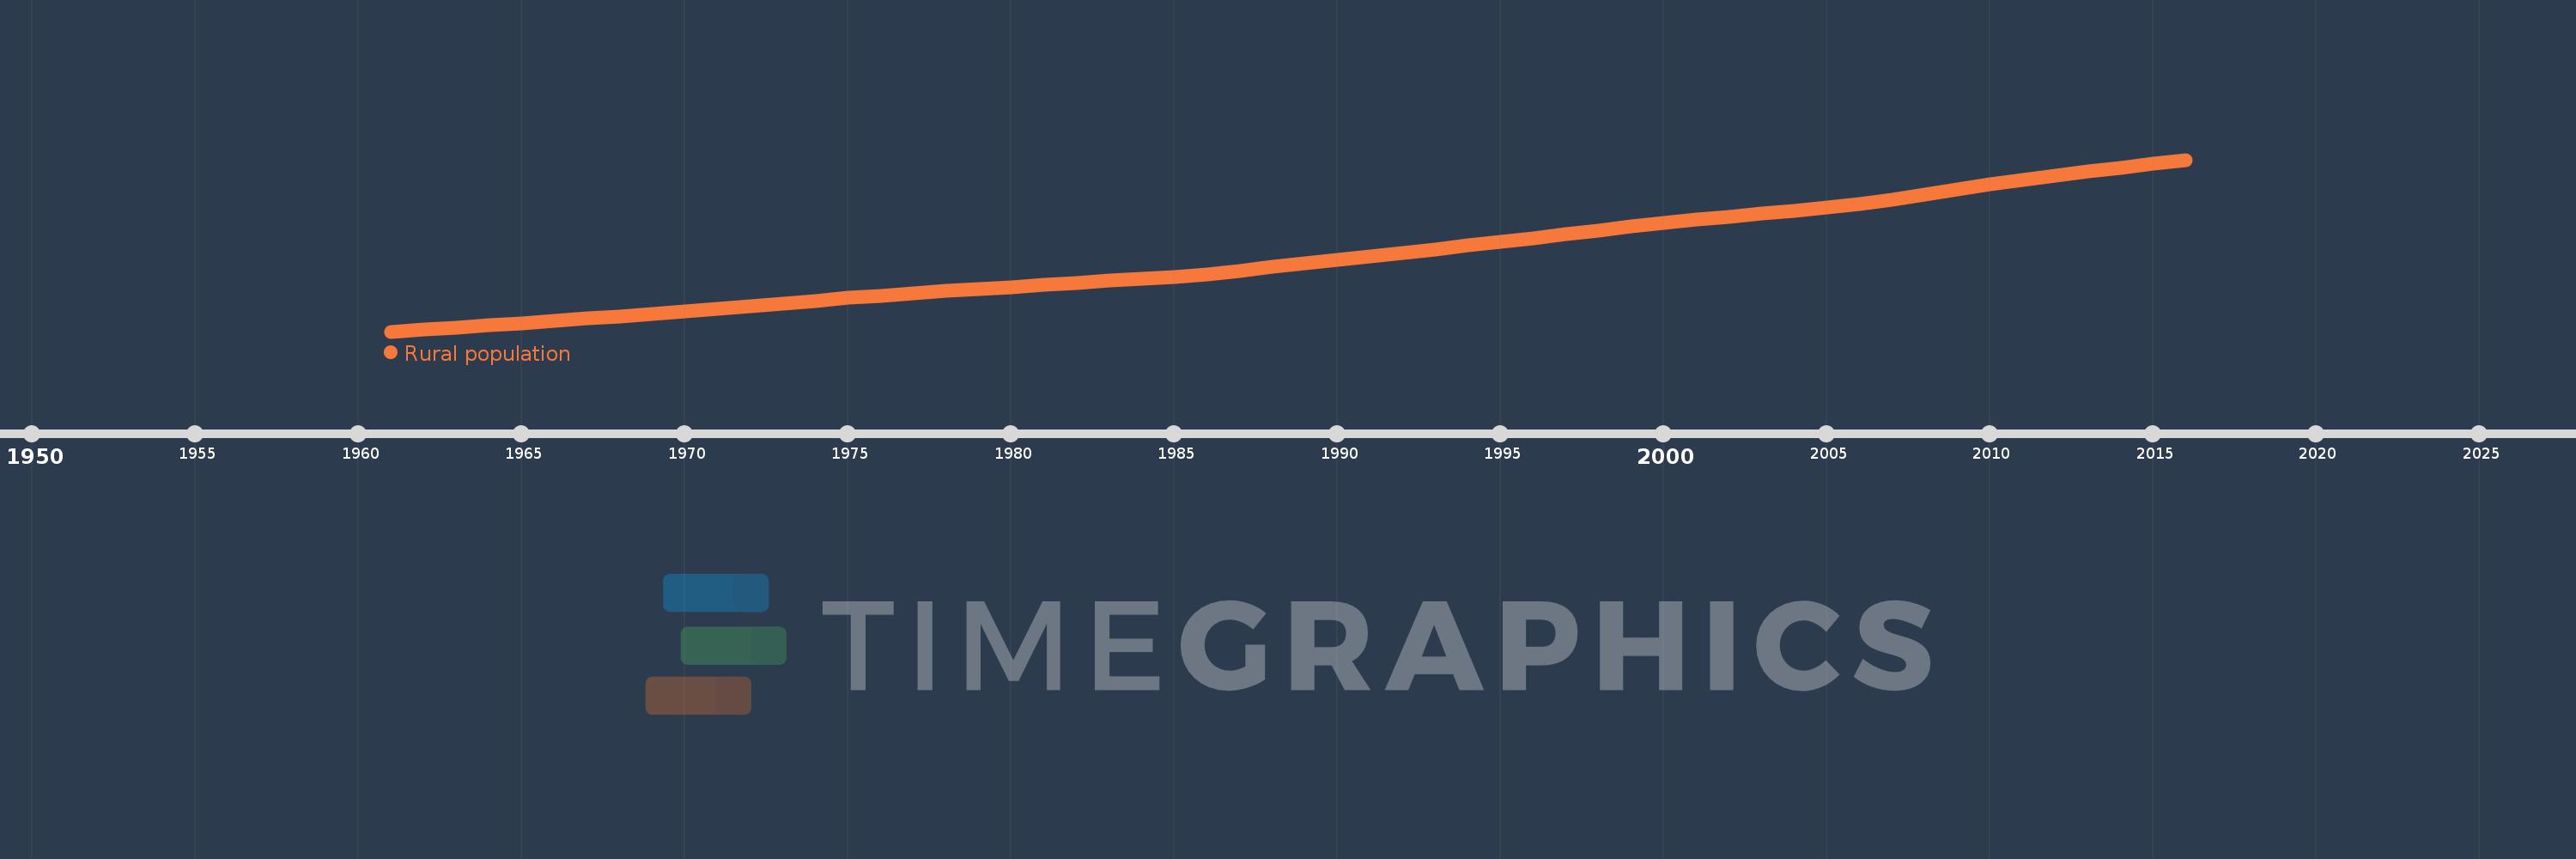
Rural population
2016,2015,2014,2013,2012,2011,2010,2009,2008,2007,2006,2005,2004,2003,2002,2001,2000,1999,1998,1997,1996,1995,1994,1993,1992,1991,1990,1989,1988,1987,1986,1985,1984,1983,1982,1981,1980,1979,1978,1977,1976,1975,1974,1973,1972,1971,1970,1969,1968,1967,1966,1965,1964,1963,1962,1961
This statistics in other country:
AfghanistanAlbaniaAlgeriaAmerican SamoaAndorraAngolaAntigua and BarbudaArab WorldArgentinaArmeniaArubaAustraliaAustriaAzerbaijanBahamas, TheBahrainBangladeshBarbadosBelarusBelgiumBelizeBeninBermudaBhutanBoliviaBosnia and HerzegovinaBotswanaBrazilBritish Virgin IslandsBrunei DarussalamBulgariaBurkina FasoBurundiCabo VerdeCambodiaCameroonCanadaCaribbean small statesCayman IslandsCentral African RepublicCentral Europe and the BalticsChadChannel IslandsChileChinaColombiaComorosCongo, Dem. Rep.Congo, Rep.Costa RicaCote d'IvoireCroatiaCubaCuracaoCyprusCzech RepublicDenmarkDjiboutiDominicaDominican RepublicEarly-demographic dividendEast Asia & PacificEast Asia & Pacific (excluding high income)East Asia & Pacific (IDA & IBRD countries)EcuadorEgypt, Arab Rep.El SalvadorEquatorial GuineaEritreaEstoniaEthiopiaEuro areaEurope & Central AsiaEurope & Central Asia (excluding high income)Europe & Central Asia (IDA & IBRD countries)European UnionFaroe IslandsFijiFinlandFragile and conflict affected situationsFranceFrench PolynesiaGabonGambia, TheGeorgiaGermanyGhanaGibraltarGreeceGreenlandGrenadaGuamGuatemalaGuineaGuinea-BissauGuyanaHaitiHeavily indebted poor countries (HIPC)High incomeHondurasHong Kong SAR, ChinaHungaryIBRD onlyIcelandIDA & IBRD totalIDA blendIDA onlyIDA totalIndiaIndonesiaIran, Islamic Rep.IraqIrelandIsle of ManIsraelItalyJamaicaJapanJordanKazakhstanKenyaKiribatiKorea, Dem. People’s Rep.Korea, Rep.KuwaitKyrgyz RepublicLao PDRLate-demographic dividendLatin America & Caribbean Latin America & Caribbean (excluding high income)Latin America & the Caribbean (IDA & IBRD countries)LatviaLeast developed countries: UN classificationLebanonLesothoLiberiaLibyaLiechtensteinLithuaniaLow & middle incomeLow incomeLower middle incomeLuxembourgMacao SAR, ChinaMacedonia, FYRMadagascarMalawiMalaysiaMaldivesMaliMaltaMarshall IslandsMauritaniaMauritiusMexicoMicronesia, Fed. Sts.Middle East & North AfricaMiddle East & North Africa (excluding high income)Middle East & North Africa (IDA & IBRD countries)Middle incomeMoldovaMonacoMongoliaMontenegroMoroccoMozambiqueMyanmarNamibiaNauruNepalNetherlandsNew CaledoniaNew ZealandNicaraguaNigerNigeriaNorth AmericaNorthern Mariana IslandsNorwayOECD membersOmanOther small statesPacific island small statesPakistanPalauPanamaPapua New GuineaParaguayPeruPhilippinesPolandPortugalPost-demographic dividendPre-demographic dividendPuerto RicoQatarRomaniaRussian FederationRwandaSamoaSan MarinoSao Tome and PrincipeSaudi ArabiaSenegalSerbiaSeychellesSierra LeoneSingaporeSint Maarten (Dutch part)Slovak RepublicSloveniaSmall statesSolomon IslandsSomaliaSouth AfricaSouth AsiaSouth Asia (IDA & IBRD)South SudanSpainSri LankaSt. Kitts and NevisSt. LuciaSt. Vincent and the GrenadinesSub-Saharan Africa Sub-Saharan Africa (excluding high income)Sub-Saharan Africa (IDA & IBRD countries)SudanSurinameSwazilandSwedenSwitzerlandSyrian Arab RepublicTajikistanTanzaniaThailandTimor-LesteTogoTongaTrinidad and TobagoTunisiaTurkeyTurkmenistanTurks and Caicos IslandsTuvaluUgandaUkraineUnited Arab EmiratesUnited KingdomUnited StatesUpper middle incomeUruguayUzbekistanVanuatuVenezuela, RBVietnamVirgin Islands (U.S.)West Bank and GazaWorldYemen, Rep.ZambiaZimbabwe Timeline:
This timeline shows a graph from 1961 to 2016 of Congo, Rep.. No data until 1960. Number of actual observations by date: 56.
Source name:
World Development Indicators
Source organization:
The data on urban population shares used to estimate rural population come from the United Nations, World Urbanization Prospects. Total population figures are World Bank estimates.
Categories, topics:
Agriculture & Rural Development
Last updated:
apr 23, 2017
Indicators value changes by year
Minimum:
693.279K
jan 1, 1961
Maximum:
1.6 mln
jan 1, 2016
At the date of observation
Value
Absolute change
Change from previous value
jan 1, 1961
693.279K
+693.279K
0.0%
jan 1, 1962
703.87K
+10.591K
1.53%
jan 1, 1963
714.819K
+10.949K
1.56%
jan 1, 1964
726.104K
+11.285K
1.58%
jan 1, 1965
737.654K
+11.55K
1.59%
jan 1, 1966
749.477K
+11.823K
1.6%
jan 1, 1967
761.462K
+11.985K
1.6%
jan 1, 1968
773.643K
+12.181K
1.6%
jan 1, 1969
786.125K
+12.482K
1.61%
jan 1, 1970
799.133K
+13.008K
1.65%
jan 1, 1971
812.683K
+13.55K
1.7%
jan 1, 1972
826.828K
+14.145K
1.74%
jan 1, 1973
841.435K
+14.607K
1.77%
jan 1, 1974
856.265K
+14.83K
1.76%
jan 1, 1975
870.34K
+14.075K
1.64%
jan 1, 1976
883.043K
+12.703K
1.46%
jan 1, 1977
895.092K
+12.049K
1.36%
jan 1, 1978
906.621K
+11.529K
1.29%
jan 1, 1979
917.712K
+11.091K
1.22%
jan 1, 1980
928.615K
+10.903K
1.19%
jan 1, 1981
939.454K
+10.839K
1.17%
jan 1, 1982
950.313K
+10.859K
1.16%
jan 1, 1983
960.999K
+10.686K
1.12%
jan 1, 1984
971.343K
+10.344K
1.08%
jan 1, 1985
981.065K
+9.722K
1.0%
jan 1, 1986
995.546K
+14.481K
1.48%
jan 1, 1987
1.015 mln
+19.113K
1.92%
jan 1, 1988
1.034 mln
+18.921K
1.86%
jan 1, 1989
1.052 mln
+18.82K
1.82%
jan 1, 1990
1.071 mln
+18.797K
1.79%
jan 1, 1991
1.09 mln
+18.846K
1.76%
jan 1, 1992
1.109 mln
+18.81K
1.73%
jan 1, 1993
1.128 mln
+18.781K
1.69%
jan 1, 1994
1.147 mln
+18.982K
1.68%
jan 1, 1995
1.166 mln
+19.474K
1.7%
jan 1, 1996
1.186 mln
+20.033K
1.72%
jan 1, 1997
1.207 mln
+20.812K
1.75%
jan 1, 1998
1.227 mln
+20.137K
1.67%
jan 1, 1999
1.247 mln
+20.103K
1.64%
jan 1, 2000
1.266 mln
+19.248K
1.54%
jan 1, 2001
1.284 mln
+17.861K
1.41%
jan 1, 2002
1.3 mln
+16.141K
1.26%
jan 1, 2003
1.315 mln
+14.796K
1.14%
jan 1, 2004
1.33 mln
+14.873K
1.13%
jan 1, 2005
1.347 mln
+16.754K
1.26%
jan 1, 2006
1.367 mln
+19.776K
1.47%
jan 1, 2007
1.39 mln
+23.272K
1.7%
jan 1, 2008
1.416 mln
+26.032K
1.87%
jan 1, 2009
1.443 mln
+27.455K
1.94%
jan 1, 2010
1.47 mln
+26.863K
1.86%
jan 1, 2011
1.495 mln
+24.932K
1.7%
jan 1, 2012
1.518 mln
+22.651K
1.51%
jan 1, 2013
1.539 mln
+20.912K
1.38%
jan 1, 2014
1.559 mln
+19.885K
1.29%
jan 1, 2015
1.579 mln
+20.048K
1.29%
jan 1, 2016
1.6 mln
+20.884K
1.32%
Ranking of countries by current statistics by years


Comments: