29
/
en
AIzaSyAYiBZKx7MnpbEhh9jyipgxe19OcubqV5w
April 1, 2024
173507
Kyrgyz Republic
KGZ
true
2
1
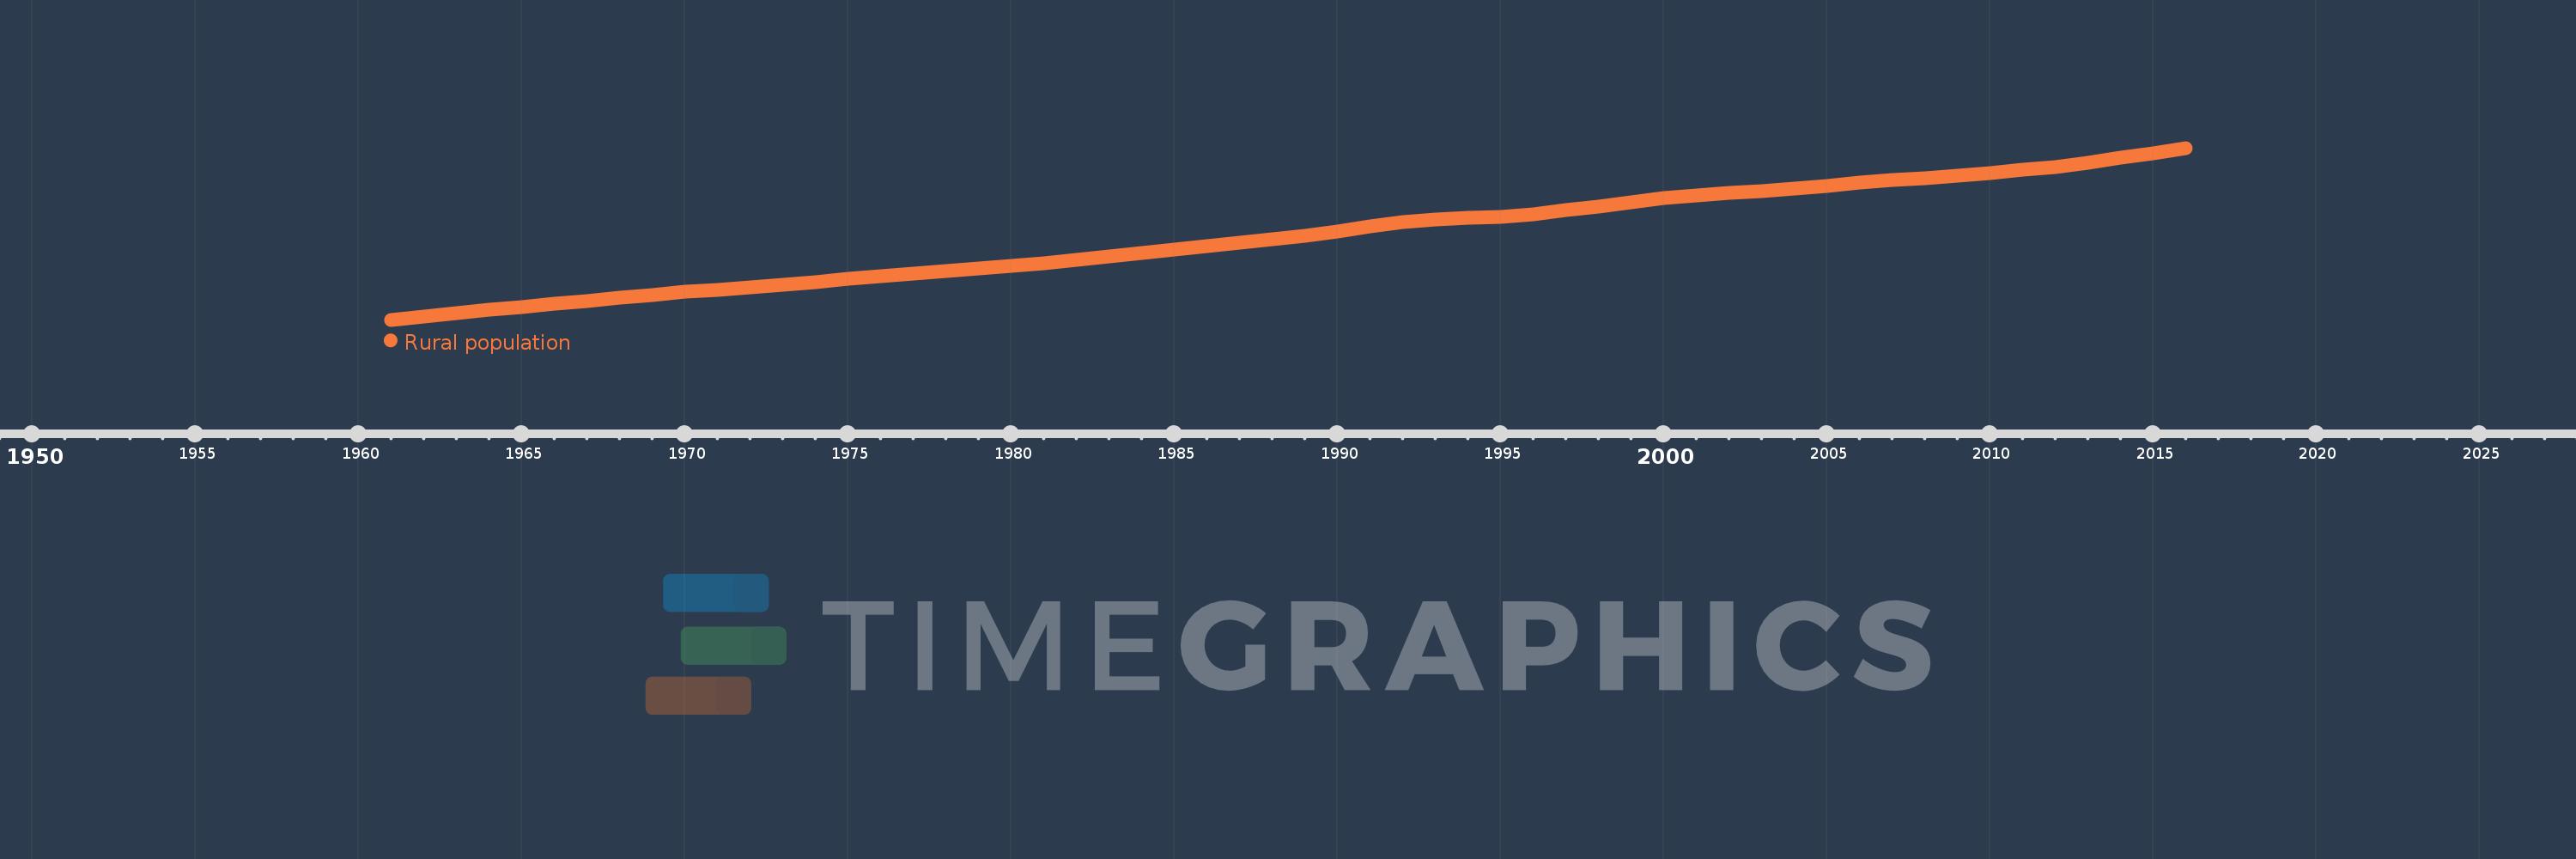
Rural population
2016,2015,2014,2013,2012,2011,2010,2009,2008,2007,2006,2005,2004,2003,2002,2001,2000,1999,1998,1997,1996,1995,1994,1993,1992,1991,1990,1989,1988,1987,1986,1985,1984,1983,1982,1981,1980,1979,1978,1977,1976,1975,1974,1973,1972,1971,1970,1969,1968,1967,1966,1965,1964,1963,1962,1961
This statistics in other country:
AfghanistanAlbaniaAlgeriaAmerican SamoaAndorraAngolaAntigua and BarbudaArab WorldArgentinaArmeniaArubaAustraliaAustriaAzerbaijanBahamas, TheBahrainBangladeshBarbadosBelarusBelgiumBelizeBeninBermudaBhutanBoliviaBosnia and HerzegovinaBotswanaBrazilBritish Virgin IslandsBrunei DarussalamBulgariaBurkina FasoBurundiCabo VerdeCambodiaCameroonCanadaCaribbean small statesCayman IslandsCentral African RepublicCentral Europe and the BalticsChadChannel IslandsChileChinaColombiaComorosCongo, Dem. Rep.Congo, Rep.Costa RicaCote d'IvoireCroatiaCubaCuracaoCyprusCzech RepublicDenmarkDjiboutiDominicaDominican RepublicEarly-demographic dividendEast Asia & PacificEast Asia & Pacific (excluding high income)East Asia & Pacific (IDA & IBRD countries)EcuadorEgypt, Arab Rep.El SalvadorEquatorial GuineaEritreaEstoniaEthiopiaEuro areaEurope & Central AsiaEurope & Central Asia (excluding high income)Europe & Central Asia (IDA & IBRD countries)European UnionFaroe IslandsFijiFinlandFragile and conflict affected situationsFranceFrench PolynesiaGabonGambia, TheGeorgiaGermanyGhanaGibraltarGreeceGreenlandGrenadaGuamGuatemalaGuineaGuinea-BissauGuyanaHaitiHeavily indebted poor countries (HIPC)High incomeHondurasHong Kong SAR, ChinaHungaryIBRD onlyIcelandIDA & IBRD totalIDA blendIDA onlyIDA totalIndiaIndonesiaIran, Islamic Rep.IraqIrelandIsle of ManIsraelItalyJamaicaJapanJordanKazakhstanKenyaKiribatiKorea, Dem. People’s Rep.Korea, Rep.KuwaitKyrgyz RepublicLao PDRLate-demographic dividendLatin America & Caribbean Latin America & Caribbean (excluding high income)Latin America & the Caribbean (IDA & IBRD countries)LatviaLeast developed countries: UN classificationLebanonLesothoLiberiaLibyaLiechtensteinLithuaniaLow & middle incomeLow incomeLower middle incomeLuxembourgMacao SAR, ChinaMacedonia, FYRMadagascarMalawiMalaysiaMaldivesMaliMaltaMarshall IslandsMauritaniaMauritiusMexicoMicronesia, Fed. Sts.Middle East & North AfricaMiddle East & North Africa (excluding high income)Middle East & North Africa (IDA & IBRD countries)Middle incomeMoldovaMonacoMongoliaMontenegroMoroccoMozambiqueMyanmarNamibiaNauruNepalNetherlandsNew CaledoniaNew ZealandNicaraguaNigerNigeriaNorth AmericaNorthern Mariana IslandsNorwayOECD membersOmanOther small statesPacific island small statesPakistanPalauPanamaPapua New GuineaParaguayPeruPhilippinesPolandPortugalPost-demographic dividendPre-demographic dividendPuerto RicoQatarRomaniaRussian FederationRwandaSamoaSan MarinoSao Tome and PrincipeSaudi ArabiaSenegalSerbiaSeychellesSierra LeoneSingaporeSint Maarten (Dutch part)Slovak RepublicSloveniaSmall statesSolomon IslandsSomaliaSouth AfricaSouth AsiaSouth Asia (IDA & IBRD)South SudanSpainSri LankaSt. Kitts and NevisSt. LuciaSt. Vincent and the GrenadinesSub-Saharan Africa Sub-Saharan Africa (excluding high income)Sub-Saharan Africa (IDA & IBRD countries)SudanSurinameSwazilandSwedenSwitzerlandSyrian Arab RepublicTajikistanTanzaniaThailandTimor-LesteTogoTongaTrinidad and TobagoTunisiaTurkeyTurkmenistanTurks and Caicos IslandsTuvaluUgandaUkraineUnited Arab EmiratesUnited KingdomUnited StatesUpper middle incomeUruguayUzbekistanVanuatuVenezuela, RBVietnamVirgin Islands (U.S.)West Bank and GazaWorldYemen, Rep.ZambiaZimbabwe Timeline:
This timeline shows a graph from 1961 to 2016 of Kyrgyz Republic. No data until 1960. Number of actual observations by date: 56.
Source name:
World Development Indicators
Source organization:
The data on urban population shares used to estimate rural population come from the United Nations, World Urbanization Prospects. Total population figures are World Bank estimates.
Categories, topics:
Agriculture & Rural Development
Last updated:
apr 23, 2017
Indicators value changes by year
Minimum:
1.43 mln
jan 1, 1961
Maximum:
3.83 mln
jan 1, 2016
At the date of observation
Value
Absolute change
Change from previous value
jan 1, 1961
1.43 mln
+1.43 mln
0.0%
jan 1, 1962
1.477 mln
+47.58K
3.33%
jan 1, 1963
1.52 mln
+42.984K
2.91%
jan 1, 1964
1.565 mln
+44.259K
2.91%
jan 1, 1965
1.609 mln
+44.485K
2.84%
jan 1, 1966
1.651 mln
+41.652K
2.59%
jan 1, 1967
1.694 mln
+43.601K
2.64%
jan 1, 1968
1.737 mln
+42.51K
2.51%
jan 1, 1969
1.779 mln
+42.308K
2.44%
jan 1, 1970
1.818 mln
+38.364K
2.16%
jan 1, 1971
1.851 mln
+33.415K
1.84%
jan 1, 1972
1.886 mln
+34.699K
1.87%
jan 1, 1973
1.922 mln
+36.669K
1.94%
jan 1, 1974
1.959 mln
+36.292K
1.89%
jan 1, 1975
1.997 mln
+38.86K
1.98%
jan 1, 1976
2.035 mln
+37.7K
1.89%
jan 1, 1977
2.071 mln
+36.113K
1.77%
jan 1, 1978
2.107 mln
+35.243K
1.7%
jan 1, 1979
2.14 mln
+33.827K
1.61%
jan 1, 1980
2.178 mln
+37.846K
1.77%
jan 1, 1981
2.22 mln
+41.914K
1.92%
jan 1, 1982
2.264 mln
+43.822K
1.97%
jan 1, 1983
2.311 mln
+47.025K
2.08%
jan 1, 1984
2.361 mln
+50.483K
2.18%
jan 1, 1985
2.411 mln
+50.008K
2.12%
jan 1, 1986
2.459 mln
+47.498K
1.97%
jan 1, 1987
2.508 mln
+48.99K
1.99%
jan 1, 1988
2.558 mln
+50.238K
2.0%
jan 1, 1989
2.606 mln
+47.661K
1.86%
jan 1, 1990
2.668 mln
+62.018K
2.38%
jan 1, 1991
2.732 mln
+64.486K
2.42%
jan 1, 1992
2.79 mln
+57.86K
2.12%
jan 1, 1993
2.836 mln
+45.34K
1.62%
jan 1, 1994
2.849 mln
+13.689K
0.48%
jan 1, 1995
2.861 mln
+11.858K
0.42%
jan 1, 1996
2.903 mln
+41.657K
1.46%
jan 1, 1997
2.959 mln
+56.381K
1.94%
jan 1, 1998
3.016 mln
+56.672K
1.92%
jan 1, 1999
3.076 mln
+60.021K
1.99%
jan 1, 2000
3.132 mln
+55.925K
1.82%
jan 1, 2001
3.169 mln
+37.624K
1.2%
jan 1, 2002
3.2 mln
+30.315K
0.96%
jan 1, 2003
3.229 mln
+29.554K
0.92%
jan 1, 2004
3.263 mln
+34.136K
1.06%
jan 1, 2005
3.303 mln
+39.781K
1.22%
jan 1, 2006
3.341 mln
+37.569K
1.14%
jan 1, 2007
3.377 mln
+36.161K
1.08%
jan 1, 2008
3.409 mln
+32.461K
0.96%
jan 1, 2009
3.442 mln
+32.657K
0.96%
jan 1, 2010
3.484 mln
+41.859K
1.22%
jan 1, 2011
3.525 mln
+40.772K
1.17%
jan 1, 2012
3.566 mln
+41.002K
1.16%
jan 1, 2013
3.622 mln
+56.453K
1.58%
jan 1, 2014
3.69 mln
+68.031K
1.88%
jan 1, 2015
3.759 mln
+68.823K
1.87%
jan 1, 2016
3.83 mln
+70.997K
1.89%
Ranking of countries by current statistics by years


Comments: