29
/
en
AIzaSyAYiBZKx7MnpbEhh9jyipgxe19OcubqV5w
April 1, 2024
134561
France
FRA
true
2
1
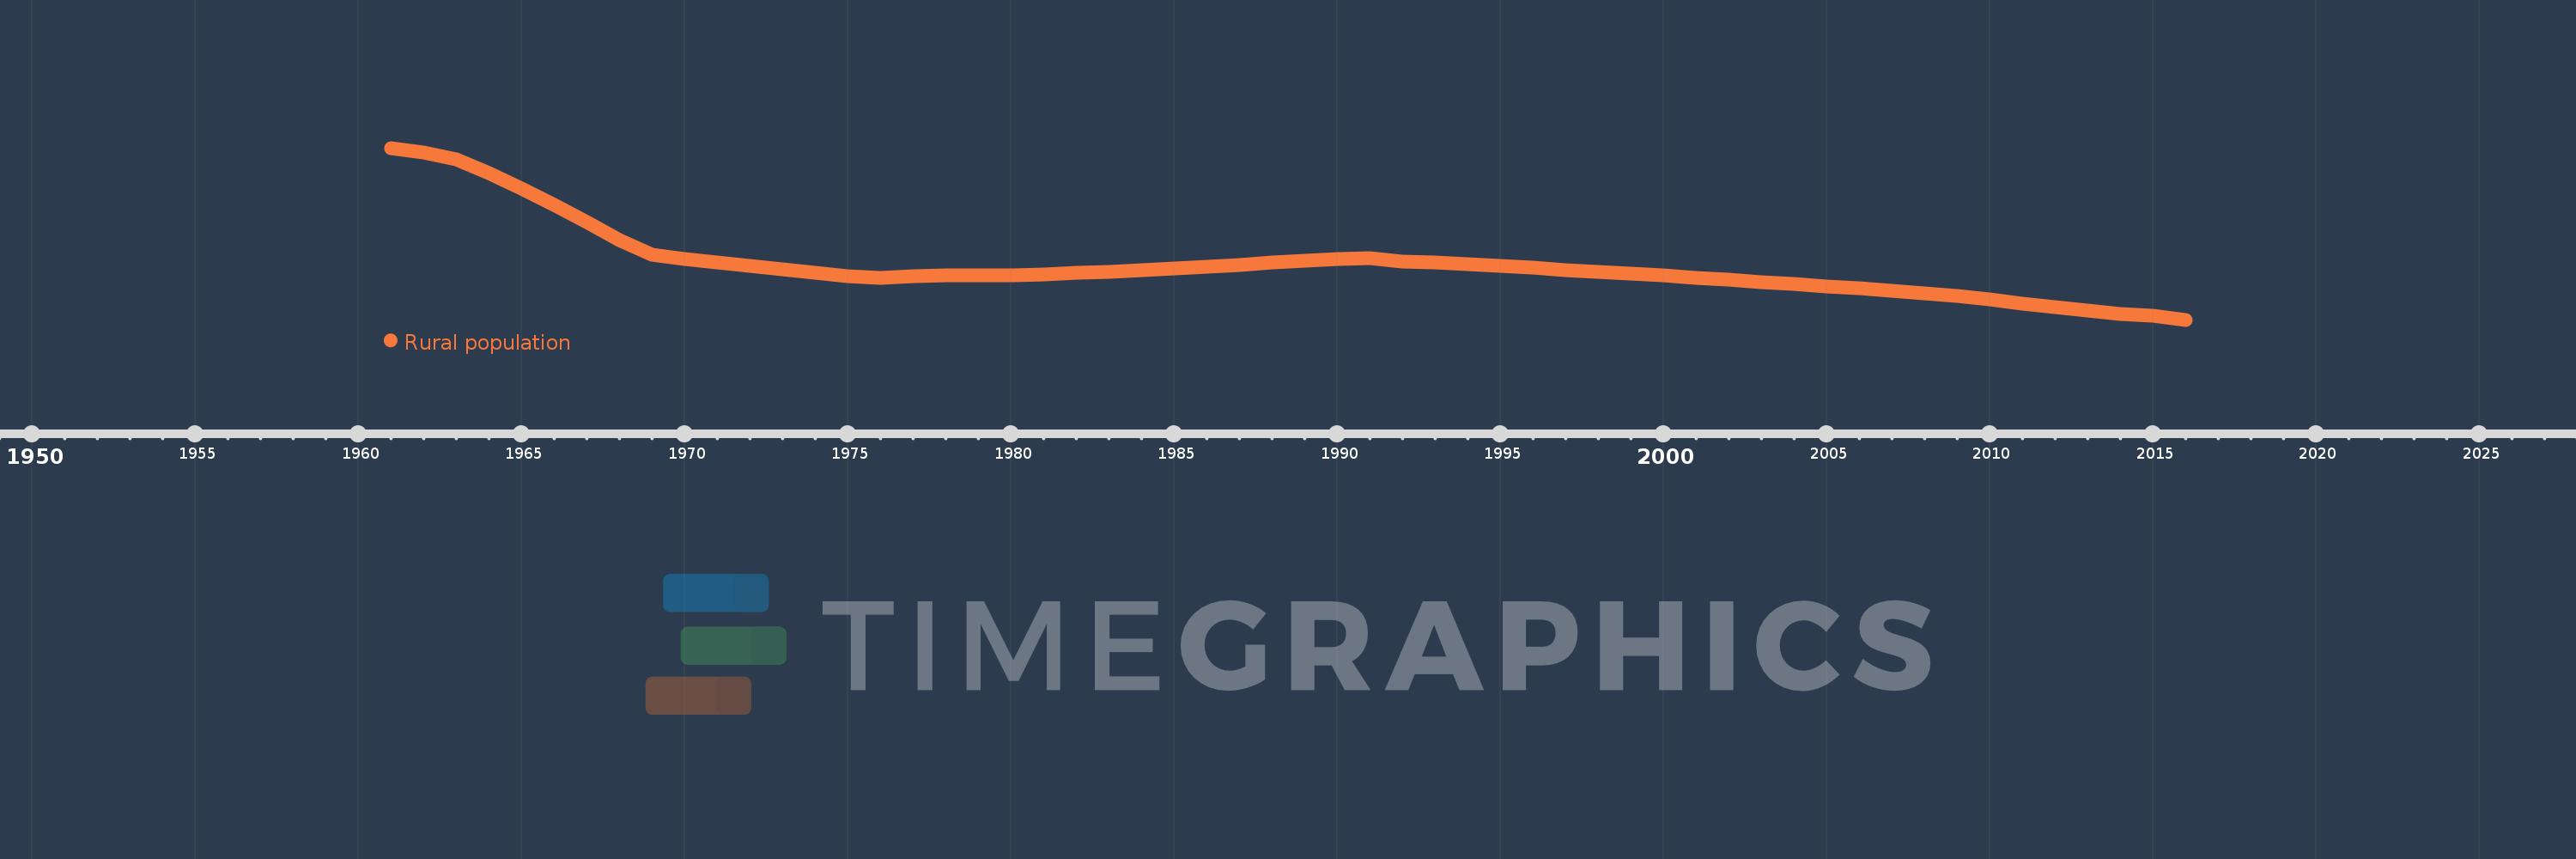
Rural population
2016,2015,2014,2013,2012,2011,2010,2009,2008,2007,2006,2005,2004,2003,2002,2001,2000,1999,1998,1997,1996,1995,1994,1993,1992,1991,1990,1989,1988,1987,1986,1985,1984,1983,1982,1981,1980,1979,1978,1977,1976,1975,1974,1973,1972,1971,1970,1969,1968,1967,1966,1965,1964,1963,1962,1961
This statistics in other country:
AfghanistanAlbaniaAlgeriaAmerican SamoaAndorraAngolaAntigua and BarbudaArab WorldArgentinaArmeniaArubaAustraliaAustriaAzerbaijanBahamas, TheBahrainBangladeshBarbadosBelarusBelgiumBelizeBeninBermudaBhutanBoliviaBosnia and HerzegovinaBotswanaBrazilBritish Virgin IslandsBrunei DarussalamBulgariaBurkina FasoBurundiCabo VerdeCambodiaCameroonCanadaCaribbean small statesCayman IslandsCentral African RepublicCentral Europe and the BalticsChadChannel IslandsChileChinaColombiaComorosCongo, Dem. Rep.Congo, Rep.Costa RicaCote d'IvoireCroatiaCubaCuracaoCyprusCzech RepublicDenmarkDjiboutiDominicaDominican RepublicEarly-demographic dividendEast Asia & PacificEast Asia & Pacific (excluding high income)East Asia & Pacific (IDA & IBRD countries)EcuadorEgypt, Arab Rep.El SalvadorEquatorial GuineaEritreaEstoniaEthiopiaEuro areaEurope & Central AsiaEurope & Central Asia (excluding high income)Europe & Central Asia (IDA & IBRD countries)European UnionFaroe IslandsFijiFinlandFragile and conflict affected situationsFranceFrench PolynesiaGabonGambia, TheGeorgiaGermanyGhanaGibraltarGreeceGreenlandGrenadaGuamGuatemalaGuineaGuinea-BissauGuyanaHaitiHeavily indebted poor countries (HIPC)High incomeHondurasHong Kong SAR, ChinaHungaryIBRD onlyIcelandIDA & IBRD totalIDA blendIDA onlyIDA totalIndiaIndonesiaIran, Islamic Rep.IraqIrelandIsle of ManIsraelItalyJamaicaJapanJordanKazakhstanKenyaKiribatiKorea, Dem. People’s Rep.Korea, Rep.KuwaitKyrgyz RepublicLao PDRLate-demographic dividendLatin America & Caribbean Latin America & Caribbean (excluding high income)Latin America & the Caribbean (IDA & IBRD countries)LatviaLeast developed countries: UN classificationLebanonLesothoLiberiaLibyaLiechtensteinLithuaniaLow & middle incomeLow incomeLower middle incomeLuxembourgMacao SAR, ChinaMacedonia, FYRMadagascarMalawiMalaysiaMaldivesMaliMaltaMarshall IslandsMauritaniaMauritiusMexicoMicronesia, Fed. Sts.Middle East & North AfricaMiddle East & North Africa (excluding high income)Middle East & North Africa (IDA & IBRD countries)Middle incomeMoldovaMonacoMongoliaMontenegroMoroccoMozambiqueMyanmarNamibiaNauruNepalNetherlandsNew CaledoniaNew ZealandNicaraguaNigerNigeriaNorth AmericaNorthern Mariana IslandsNorwayOECD membersOmanOther small statesPacific island small statesPakistanPalauPanamaPapua New GuineaParaguayPeruPhilippinesPolandPortugalPost-demographic dividendPre-demographic dividendPuerto RicoQatarRomaniaRussian FederationRwandaSamoaSan MarinoSao Tome and PrincipeSaudi ArabiaSenegalSerbiaSeychellesSierra LeoneSingaporeSint Maarten (Dutch part)Slovak RepublicSloveniaSmall statesSolomon IslandsSomaliaSouth AfricaSouth AsiaSouth Asia (IDA & IBRD)South SudanSpainSri LankaSt. Kitts and NevisSt. LuciaSt. Vincent and the GrenadinesSub-Saharan Africa Sub-Saharan Africa (excluding high income)Sub-Saharan Africa (IDA & IBRD countries)SudanSurinameSwazilandSwedenSwitzerlandSyrian Arab RepublicTajikistanTanzaniaThailandTimor-LesteTogoTongaTrinidad and TobagoTunisiaTurkeyTurkmenistanTurks and Caicos IslandsTuvaluUgandaUkraineUnited Arab EmiratesUnited KingdomUnited StatesUpper middle incomeUruguayUzbekistanVanuatuVenezuela, RBVietnamVirgin Islands (U.S.)West Bank and GazaWorldYemen, Rep.ZambiaZimbabwe Timeline:
This timeline shows a graph from 1961 to 2016 of France. No data until 1960. Number of actual observations by date: 56.
Source name:
World Development Indicators
Source organization:
The data on urban population shares used to estimate rural population come from the United Nations, World Urbanization Prospects. Total population figures are World Bank estimates.
Categories, topics:
Agriculture & Rural Development
Last updated:
apr 23, 2017
Indicators value changes by year
Minimum:
13.682 mln
jan 1, 2016
Maximum:
17.846 mln
jan 1, 1961
At the date of observation
Value
Absolute change
Change from previous value
jan 1, 1961
17.846 mln
+17.846 mln
0.0%
jan 1, 1962
17.741 mln
-104.571K
-0.59%
jan 1, 1963
17.569 mln
-172.051K
-0.97%
jan 1, 1964
17.227 mln
-342.242K
-1.95%
jan 1, 1965
16.863 mln
-363.488K
-2.11%
jan 1, 1966
16.472 mln
-390.906K
-2.32%
jan 1, 1967
16.049 mln
-423.184K
-2.57%
jan 1, 1968
15.602 mln
-447.122K
-2.79%
jan 1, 1969
15.261 mln
-341.244K
-2.19%
jan 1, 1970
15.157 mln
-103.917K
-0.68%
jan 1, 1971
15.062 mln
-95.304K
-0.63%
jan 1, 1972
14.978 mln
-83.121K
-0.55%
jan 1, 1973
14.903 mln
-75.71K
-0.51%
jan 1, 1974
14.827 mln
-75.983K
-0.51%
jan 1, 1975
14.737 mln
-89.903K
-0.61%
jan 1, 1976
14.688 mln
-48.499K
-0.33%
jan 1, 1977
14.728 mln
+39.497K
0.27%
jan 1, 1978
14.749 mln
+21.326K
0.14%
jan 1, 1979
14.759 mln
+9.861K
0.07%
jan 1, 1980
14.769 mln
+9.909K
0.07%
jan 1, 1981
14.786 mln
+17.015K
0.12%
jan 1, 1982
14.813 mln
+26.56K
0.18%
jan 1, 1983
14.844 mln
+31.947K
0.22%
jan 1, 1984
14.881 mln
+36.958K
0.25%
jan 1, 1985
14.922 mln
+40.986K
0.28%
jan 1, 1986
14.966 mln
+43.262K
0.29%
jan 1, 1987
15.012 mln
+45.952K
0.31%
jan 1, 1988
15.06 mln
+48.824K
0.33%
jan 1, 1989
15.11 mln
+49.343K
0.33%
jan 1, 1990
15.157 mln
+46.812K
0.31%
jan 1, 1991
15.181 mln
+23.969K
0.16%
jan 1, 1992
15.091 mln
-89.243K
-0.59%
jan 1, 1993
15.065 mln
-25.997K
-0.17%
jan 1, 1994
15.03 mln
-35.655K
-0.24%
jan 1, 1995
14.984 mln
-45.399K
-0.3%
jan 1, 1996
14.938 mln
-46.397K
-0.31%
jan 1, 1997
14.889 mln
-48.595K
-0.33%
jan 1, 1998
14.841 mln
-47.978K
-0.32%
jan 1, 1999
14.796 mln
-45.703K
-0.31%
jan 1, 2000
14.753 mln
-42.867K
-0.29%
jan 1, 2001
14.698 mln
-55.152K
-0.37%
jan 1, 2002
14.648 mln
-49.717K
-0.34%
jan 1, 2003
14.598 mln
-49.456K
-0.34%
jan 1, 2004
14.545 mln
-53.02K
-0.36%
jan 1, 2005
14.495 mln
-49.893K
-0.34%
jan 1, 2006
14.449 mln
-46.372K
-0.32%
jan 1, 2007
14.393 mln
-56.055K
-0.39%
jan 1, 2008
14.326 mln
-66.872K
-0.46%
jan 1, 2009
14.25 mln
-76.144K
-0.53%
jan 1, 2010
14.167 mln
-83.088K
-0.58%
jan 1, 2011
14.082 mln
-85.252K
-0.6%
jan 1, 2012
13.994 mln
-87.899K
-0.62%
jan 1, 2013
13.907 mln
-87.065K
-0.62%
jan 1, 2014
13.818 mln
-88.888K
-0.64%
jan 1, 2015
13.772 mln
-45.882K
-0.33%
jan 1, 2016
13.682 mln
-89.617K
-0.65%
Ranking of countries by current statistics by years


Comments: