29
/
en
AIzaSyAYiBZKx7MnpbEhh9jyipgxe19OcubqV5w
April 1, 2024
55864
Pre-demographic dividend
PRE
false
2
1
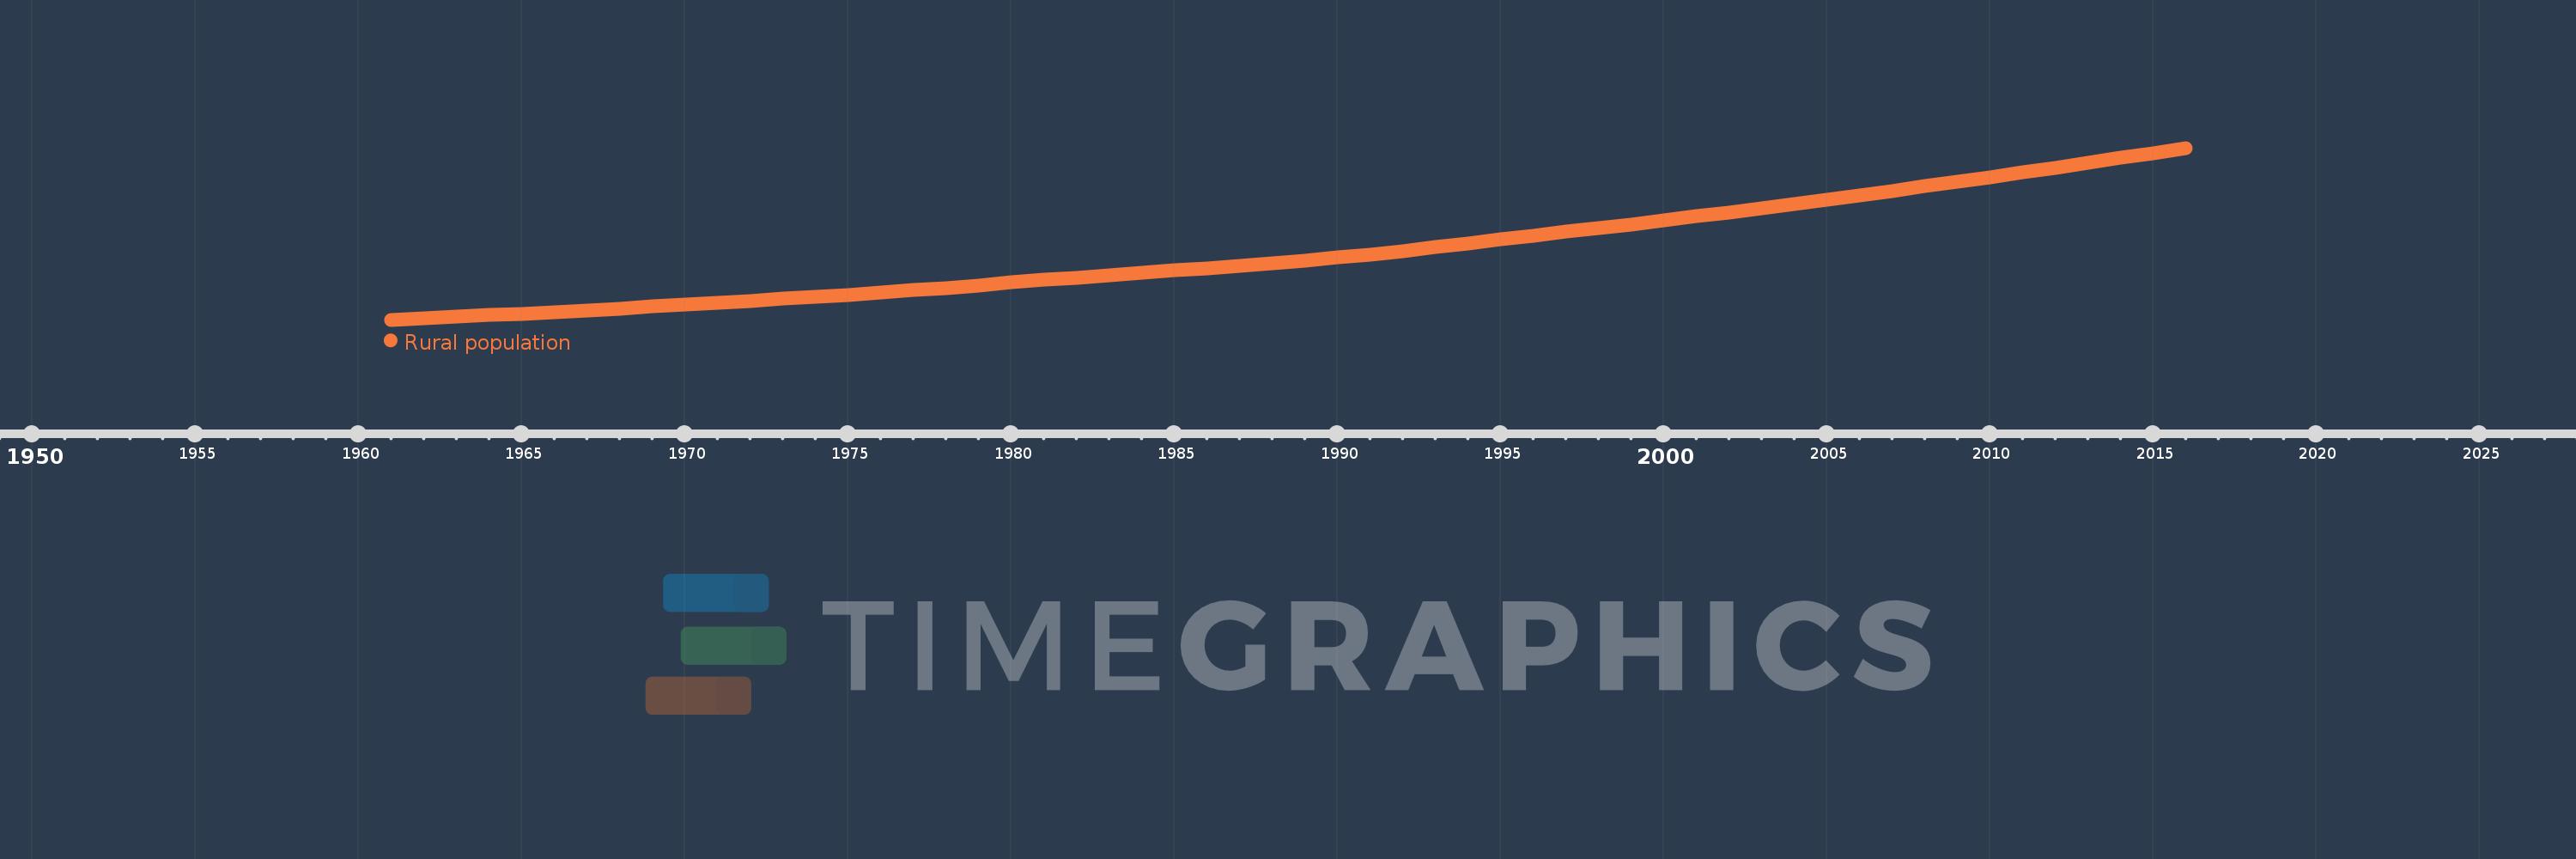
Rural population
2016,2015,2014,2013,2012,2011,2010,2009,2008,2007,2006,2005,2004,2003,2002,2001,2000,1999,1998,1997,1996,1995,1994,1993,1992,1991,1990,1989,1988,1987,1986,1985,1984,1983,1982,1981,1980,1979,1978,1977,1976,1975,1974,1973,1972,1971,1970,1969,1968,1967,1966,1965,1964,1963,1962,1961
This statistics in other country:
AfghanistanAlbaniaAlgeriaAmerican SamoaAndorraAngolaAntigua and BarbudaArab WorldArgentinaArmeniaArubaAustraliaAustriaAzerbaijanBahamas, TheBahrainBangladeshBarbadosBelarusBelgiumBelizeBeninBermudaBhutanBoliviaBosnia and HerzegovinaBotswanaBrazilBritish Virgin IslandsBrunei DarussalamBulgariaBurkina FasoBurundiCabo VerdeCambodiaCameroonCanadaCaribbean small statesCayman IslandsCentral African RepublicCentral Europe and the BalticsChadChannel IslandsChileChinaColombiaComorosCongo, Dem. Rep.Congo, Rep.Costa RicaCote d'IvoireCroatiaCubaCuracaoCyprusCzech RepublicDenmarkDjiboutiDominicaDominican RepublicEarly-demographic dividendEast Asia & PacificEast Asia & Pacific (excluding high income)East Asia & Pacific (IDA & IBRD countries)EcuadorEgypt, Arab Rep.El SalvadorEquatorial GuineaEritreaEstoniaEthiopiaEuro areaEurope & Central AsiaEurope & Central Asia (excluding high income)Europe & Central Asia (IDA & IBRD countries)European UnionFaroe IslandsFijiFinlandFragile and conflict affected situationsFranceFrench PolynesiaGabonGambia, TheGeorgiaGermanyGhanaGibraltarGreeceGreenlandGrenadaGuamGuatemalaGuineaGuinea-BissauGuyanaHaitiHeavily indebted poor countries (HIPC)High incomeHondurasHong Kong SAR, ChinaHungaryIBRD onlyIcelandIDA & IBRD totalIDA blendIDA onlyIDA totalIndiaIndonesiaIran, Islamic Rep.IraqIrelandIsle of ManIsraelItalyJamaicaJapanJordanKazakhstanKenyaKiribatiKorea, Dem. People’s Rep.Korea, Rep.KuwaitKyrgyz RepublicLao PDRLate-demographic dividendLatin America & Caribbean Latin America & Caribbean (excluding high income)Latin America & the Caribbean (IDA & IBRD countries)LatviaLeast developed countries: UN classificationLebanonLesothoLiberiaLibyaLiechtensteinLithuaniaLow & middle incomeLow incomeLower middle incomeLuxembourgMacao SAR, ChinaMacedonia, FYRMadagascarMalawiMalaysiaMaldivesMaliMaltaMarshall IslandsMauritaniaMauritiusMexicoMicronesia, Fed. Sts.Middle East & North AfricaMiddle East & North Africa (excluding high income)Middle East & North Africa (IDA & IBRD countries)Middle incomeMoldovaMonacoMongoliaMontenegroMoroccoMozambiqueMyanmarNamibiaNauruNepalNetherlandsNew CaledoniaNew ZealandNicaraguaNigerNigeriaNorth AmericaNorthern Mariana IslandsNorwayOECD membersOmanOther small statesPacific island small statesPakistanPalauPanamaPapua New GuineaParaguayPeruPhilippinesPolandPortugalPost-demographic dividendPre-demographic dividendPuerto RicoQatarRomaniaRussian FederationRwandaSamoaSan MarinoSao Tome and PrincipeSaudi ArabiaSenegalSerbiaSeychellesSierra LeoneSingaporeSint Maarten (Dutch part)Slovak RepublicSloveniaSmall statesSolomon IslandsSomaliaSouth AfricaSouth AsiaSouth Asia (IDA & IBRD)South SudanSpainSri LankaSt. Kitts and NevisSt. LuciaSt. Vincent and the GrenadinesSub-Saharan Africa Sub-Saharan Africa (excluding high income)Sub-Saharan Africa (IDA & IBRD countries)SudanSurinameSwazilandSwedenSwitzerlandSyrian Arab RepublicTajikistanTanzaniaThailandTimor-LesteTogoTongaTrinidad and TobagoTunisiaTurkeyTurkmenistanTurks and Caicos IslandsTuvaluUgandaUkraineUnited Arab EmiratesUnited KingdomUnited StatesUpper middle incomeUruguayUzbekistanVanuatuVenezuela, RBVietnamVirgin Islands (U.S.)West Bank and GazaWorldYemen, Rep.ZambiaZimbabwe Timeline:
This timeline shows a graph from 1961 to 2016 of Pre-demographic dividend. No data until 1960. Number of actual observations by date: 56.
Source name:
World Development Indicators
Source organization:
The data on urban population shares used to estimate rural population come from the United Nations, World Urbanization Prospects. Total population figures are World Bank estimates.
Categories, topics:
Agriculture & Rural Development
Last updated:
apr 23, 2017
Indicators value changes by year
Minimum:
163.217 mln
jan 1, 1961
Maximum:
522.109 mln
jan 1, 2016
At the date of observation
Value
Absolute change
Change from previous value
jan 1, 1961
163.217 mln
+163.217 mln
0.0%
jan 1, 1962
166.254 mln
+3.037 mln
1.86%
jan 1, 1963
169.396 mln
+3.142 mln
1.89%
jan 1, 1964
172.637 mln
+3.24 mln
1.91%
jan 1, 1965
175.975 mln
+3.339 mln
1.93%
jan 1, 1966
179.427 mln
+3.452 mln
1.96%
jan 1, 1967
183.065 mln
+3.638 mln
2.03%
jan 1, 1968
186.837 mln
+3.772 mln
2.06%
jan 1, 1969
190.688 mln
+3.851 mln
2.06%
jan 1, 1970
194.619 mln
+3.931 mln
2.06%
jan 1, 1971
198.658 mln
+4.039 mln
2.08%
jan 1, 1972
202.643 mln
+3.985 mln
2.01%
jan 1, 1973
206.669 mln
+4.026 mln
1.99%
jan 1, 1974
210.822 mln
+4.154 mln
2.01%
jan 1, 1975
215.212 mln
+4.39 mln
2.08%
jan 1, 1976
219.845 mln
+4.634 mln
2.15%
jan 1, 1977
224.749 mln
+4.904 mln
2.23%
jan 1, 1978
229.946 mln
+5.197 mln
2.31%
jan 1, 1979
235.292 mln
+5.346 mln
2.32%
jan 1, 1980
240.81 mln
+5.518 mln
2.35%
jan 1, 1981
246.287 mln
+5.478 mln
2.27%
jan 1, 1982
251.438 mln
+5.15 mln
2.09%
jan 1, 1983
256.436 mln
+4.998 mln
1.99%
jan 1, 1984
261.32 mln
+4.884 mln
1.9%
jan 1, 1985
266.168 mln
+4.848 mln
1.86%
jan 1, 1986
271.113 mln
+4.945 mln
1.86%
jan 1, 1987
276.24 mln
+5.127 mln
1.89%
jan 1, 1988
281.545 mln
+5.305 mln
1.92%
jan 1, 1989
287.182 mln
+5.637 mln
2.0%
jan 1, 1990
293.215 mln
+6.033 mln
2.1%
jan 1, 1991
299.536 mln
+6.321 mln
2.16%
jan 1, 1992
306.761 mln
+7.225 mln
2.41%
jan 1, 1993
314.508 mln
+7.748 mln
2.53%
jan 1, 1994
322.539 mln
+8.031 mln
2.55%
jan 1, 1995
330.861 mln
+8.322 mln
2.58%
jan 1, 1996
339.047 mln
+8.186 mln
2.47%
jan 1, 1997
347.029 mln
+7.982 mln
2.35%
jan 1, 1998
354.796 mln
+7.767 mln
2.24%
jan 1, 1999
362.581 mln
+7.785 mln
2.19%
jan 1, 2000
370.581 mln
+8.0 mln
2.21%
jan 1, 2001
378.962 mln
+8.382 mln
2.26%
jan 1, 2002
387.364 mln
+8.401 mln
2.22%
jan 1, 2003
396.1 mln
+8.736 mln
2.26%
jan 1, 2004
405.028 mln
+8.928 mln
2.25%
jan 1, 2005
414.121 mln
+9.093 mln
2.24%
jan 1, 2006
423.261 mln
+9.14 mln
2.21%
jan 1, 2007
432.486 mln
+9.225 mln
2.18%
jan 1, 2008
441.8 mln
+9.314 mln
2.15%
jan 1, 2009
451.246 mln
+9.446 mln
2.14%
jan 1, 2010
460.87 mln
+9.624 mln
2.13%
jan 1, 2011
470.682 mln
+9.812 mln
2.13%
jan 1, 2012
480.731 mln
+10.05 mln
2.14%
jan 1, 2013
490.941 mln
+10.21 mln
2.12%
jan 1, 2014
501.284 mln
+10.343 mln
2.11%
jan 1, 2015
511.69 mln
+10.406 mln
2.08%
jan 1, 2016
522.109 mln
+10.419 mln
2.04%
Ranking of countries by current statistics by years


Comments: