29
/
en
AIzaSyAYiBZKx7MnpbEhh9jyipgxe19OcubqV5w
April 1, 2024
146301
Guinea
GIN
true
2
1
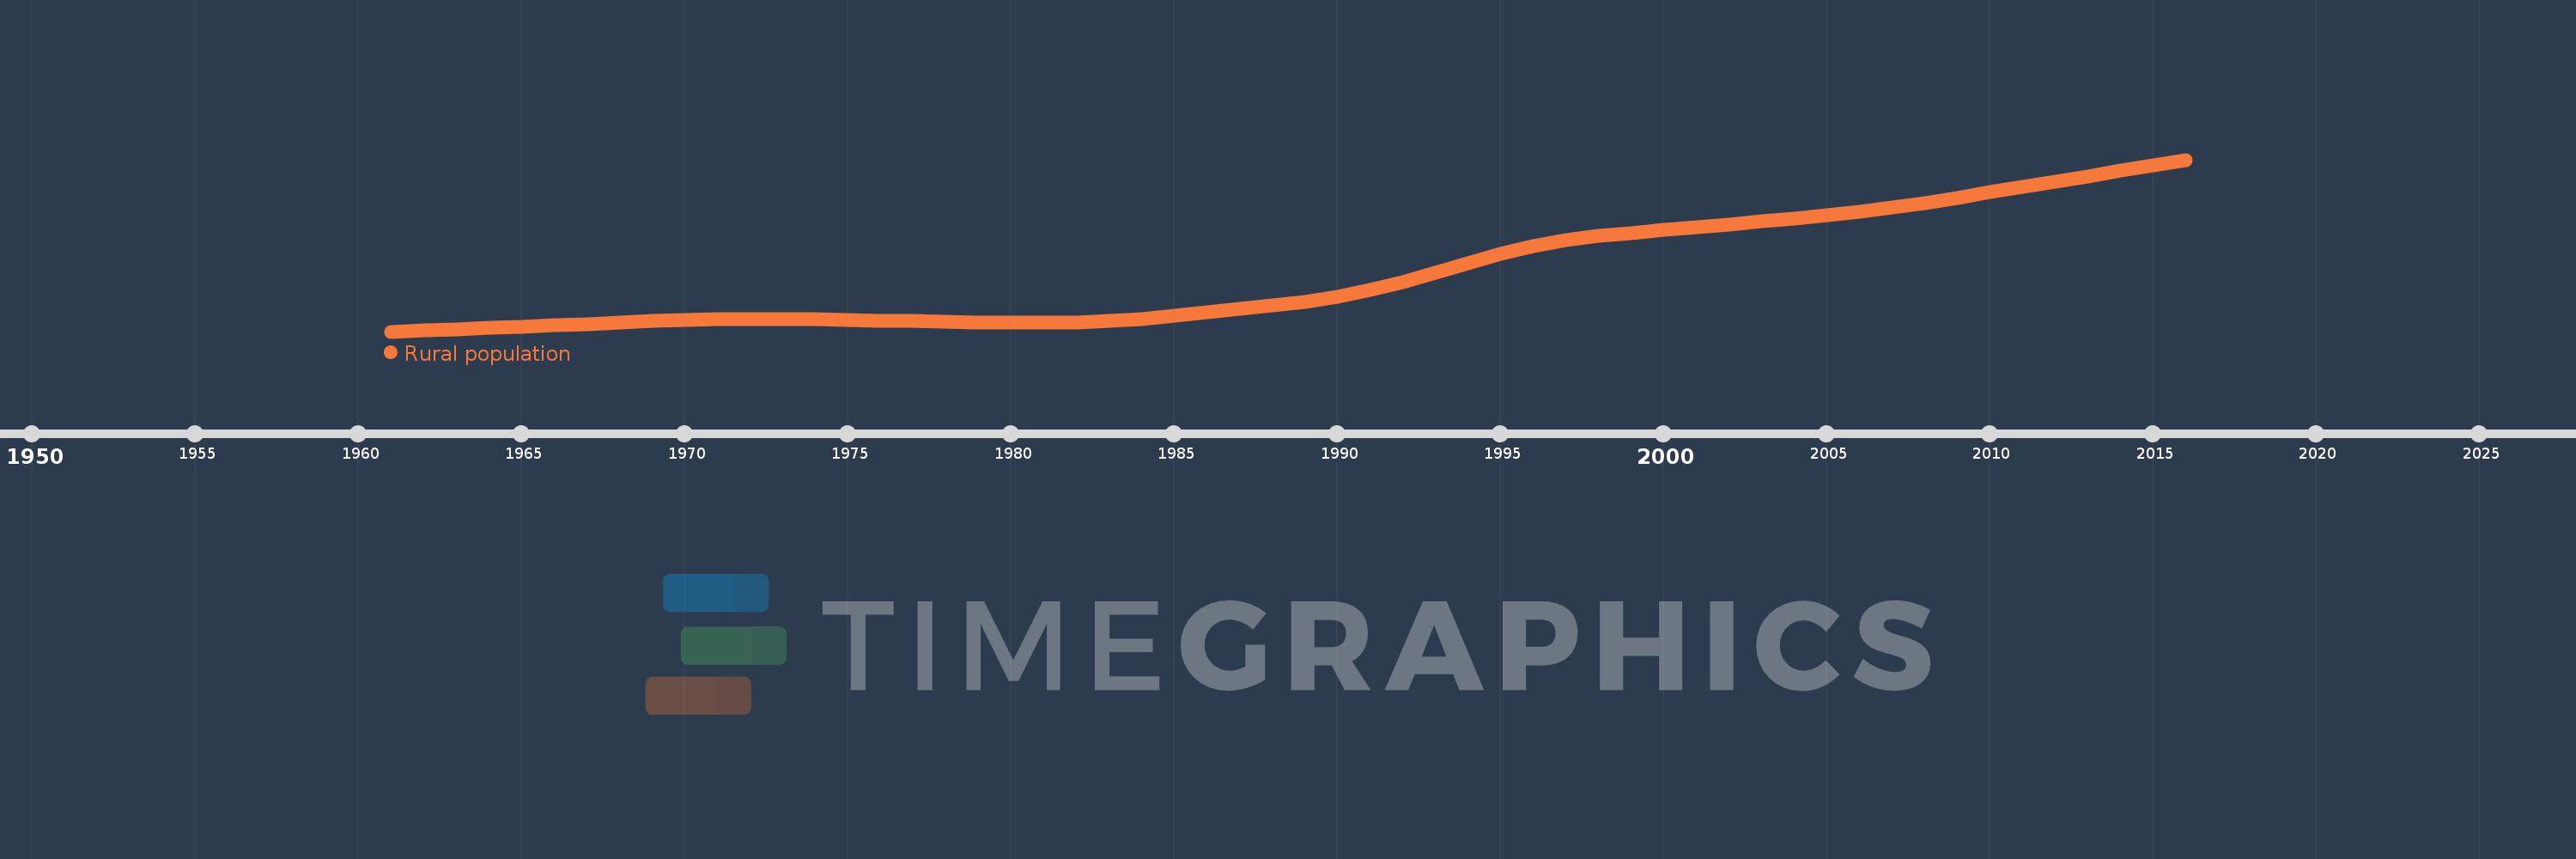
Rural population
2016,2015,2014,2013,2012,2011,2010,2009,2008,2007,2006,2005,2004,2003,2002,2001,2000,1999,1998,1997,1996,1995,1994,1993,1992,1991,1990,1989,1988,1987,1986,1985,1984,1983,1982,1981,1980,1979,1978,1977,1976,1975,1974,1973,1972,1971,1970,1969,1968,1967,1966,1965,1964,1963,1962,1961
This statistics in other country:
AfghanistanAlbaniaAlgeriaAmerican SamoaAndorraAngolaAntigua and BarbudaArab WorldArgentinaArmeniaArubaAustraliaAustriaAzerbaijanBahamas, TheBahrainBangladeshBarbadosBelarusBelgiumBelizeBeninBermudaBhutanBoliviaBosnia and HerzegovinaBotswanaBrazilBritish Virgin IslandsBrunei DarussalamBulgariaBurkina FasoBurundiCabo VerdeCambodiaCameroonCanadaCaribbean small statesCayman IslandsCentral African RepublicCentral Europe and the BalticsChadChannel IslandsChileChinaColombiaComorosCongo, Dem. Rep.Congo, Rep.Costa RicaCote d'IvoireCroatiaCubaCuracaoCyprusCzech RepublicDenmarkDjiboutiDominicaDominican RepublicEarly-demographic dividendEast Asia & PacificEast Asia & Pacific (excluding high income)East Asia & Pacific (IDA & IBRD countries)EcuadorEgypt, Arab Rep.El SalvadorEquatorial GuineaEritreaEstoniaEthiopiaEuro areaEurope & Central AsiaEurope & Central Asia (excluding high income)Europe & Central Asia (IDA & IBRD countries)European UnionFaroe IslandsFijiFinlandFragile and conflict affected situationsFranceFrench PolynesiaGabonGambia, TheGeorgiaGermanyGhanaGibraltarGreeceGreenlandGrenadaGuamGuatemalaGuineaGuinea-BissauGuyanaHaitiHeavily indebted poor countries (HIPC)High incomeHondurasHong Kong SAR, ChinaHungaryIBRD onlyIcelandIDA & IBRD totalIDA blendIDA onlyIDA totalIndiaIndonesiaIran, Islamic Rep.IraqIrelandIsle of ManIsraelItalyJamaicaJapanJordanKazakhstanKenyaKiribatiKorea, Dem. People’s Rep.Korea, Rep.KuwaitKyrgyz RepublicLao PDRLate-demographic dividendLatin America & Caribbean Latin America & Caribbean (excluding high income)Latin America & the Caribbean (IDA & IBRD countries)LatviaLeast developed countries: UN classificationLebanonLesothoLiberiaLibyaLiechtensteinLithuaniaLow & middle incomeLow incomeLower middle incomeLuxembourgMacao SAR, ChinaMacedonia, FYRMadagascarMalawiMalaysiaMaldivesMaliMaltaMarshall IslandsMauritaniaMauritiusMexicoMicronesia, Fed. Sts.Middle East & North AfricaMiddle East & North Africa (excluding high income)Middle East & North Africa (IDA & IBRD countries)Middle incomeMoldovaMonacoMongoliaMontenegroMoroccoMozambiqueMyanmarNamibiaNauruNepalNetherlandsNew CaledoniaNew ZealandNicaraguaNigerNigeriaNorth AmericaNorthern Mariana IslandsNorwayOECD membersOmanOther small statesPacific island small statesPakistanPalauPanamaPapua New GuineaParaguayPeruPhilippinesPolandPortugalPost-demographic dividendPre-demographic dividendPuerto RicoQatarRomaniaRussian FederationRwandaSamoaSan MarinoSao Tome and PrincipeSaudi ArabiaSenegalSerbiaSeychellesSierra LeoneSingaporeSint Maarten (Dutch part)Slovak RepublicSloveniaSmall statesSolomon IslandsSomaliaSouth AfricaSouth AsiaSouth Asia (IDA & IBRD)South SudanSpainSri LankaSt. Kitts and NevisSt. LuciaSt. Vincent and the GrenadinesSub-Saharan Africa Sub-Saharan Africa (excluding high income)Sub-Saharan Africa (IDA & IBRD countries)SudanSurinameSwazilandSwedenSwitzerlandSyrian Arab RepublicTajikistanTanzaniaThailandTimor-LesteTogoTongaTrinidad and TobagoTunisiaTurkeyTurkmenistanTurks and Caicos IslandsTuvaluUgandaUkraineUnited Arab EmiratesUnited KingdomUnited StatesUpper middle incomeUruguayUzbekistanVanuatuVenezuela, RBVietnamVirgin Islands (U.S.)West Bank and GazaWorldYemen, Rep.ZambiaZimbabwe Timeline:
This timeline shows a graph from 1961 to 2016 of Guinea. No data until 1960. Number of actual observations by date: 56.
Source name:
World Development Indicators
Source organization:
The data on urban population shares used to estimate rural population come from the United Nations, World Urbanization Prospects. Total population figures are World Bank estimates.
Categories, topics:
Agriculture & Rural Development
Last updated:
apr 23, 2017
Indicators value changes by year
Minimum:
3.203 mln
jan 1, 1961
Maximum:
7.923 mln
jan 1, 2016
At the date of observation
Value
Absolute change
Change from previous value
jan 1, 1961
3.203 mln
+3.203 mln
0.0%
jan 1, 1962
3.236 mln
+33.602K
1.05%
jan 1, 1963
3.27 mln
+33.138K
1.02%
jan 1, 1964
3.303 mln
+33.441K
1.02%
jan 1, 1965
3.338 mln
+34.862K
1.06%
jan 1, 1966
3.375 mln
+36.714K
1.1%
jan 1, 1967
3.414 mln
+39.194K
1.16%
jan 1, 1968
3.454 mln
+40.414K
1.18%
jan 1, 1969
3.492 mln
+37.826K
1.1%
jan 1, 1970
3.522 mln
+30.363K
0.87%
jan 1, 1971
3.542 mln
+19.601K
0.56%
jan 1, 1972
3.55 mln
+8.404K
0.24%
jan 1, 1973
3.549 mln
-1.021K
-0.03%
jan 1, 1974
3.541 mln
-8.758K
-0.25%
jan 1, 1975
3.526 mln
-14.273K
-0.4%
jan 1, 1976
3.509 mln
-17.36K
-0.49%
jan 1, 1977
3.489 mln
-20.255K
-0.58%
jan 1, 1978
3.467 mln
-21.595K
-0.62%
jan 1, 1979
3.449 mln
-18.438K
-0.53%
jan 1, 1980
3.439 mln
-9.574K
-0.28%
jan 1, 1981
3.442 mln
+3.174K
0.09%
jan 1, 1982
3.461 mln
+18.768K
0.55%
jan 1, 1983
3.494 mln
+33.335K
0.96%
jan 1, 1984
3.552 mln
+57.7K
1.65%
jan 1, 1985
3.636 mln
+84.419K
2.38%
jan 1, 1986
3.727 mln
+90.224K
2.48%
jan 1, 1987
3.819 mln
+91.831K
2.46%
jan 1, 1988
3.914 mln
+95.703K
2.51%
jan 1, 1989
4.025 mln
+110.546K
2.82%
jan 1, 1990
4.165 mln
+140.124K
3.48%
jan 1, 1991
4.343 mln
+178.075K
4.28%
jan 1, 1992
4.564 mln
+221.484K
5.1%
jan 1, 1993
4.82 mln
+255.974K
5.61%
jan 1, 1994
5.088 mln
+267.894K
5.56%
jan 1, 1995
5.337 mln
+248.798K
4.89%
jan 1, 1996
5.545 mln
+208.284K
3.9%
jan 1, 1997
5.706 mln
+160.642K
2.9%
jan 1, 1998
5.826 mln
+120.328K
2.11%
jan 1, 1999
5.917 mln
+90.152K
1.55%
jan 1, 2000
5.993 mln
+76.943K
1.3%
jan 1, 2001
6.07 mln
+76.459K
1.28%
jan 1, 2002
6.148 mln
+77.751K
1.28%
jan 1, 2003
6.225 mln
+77.197K
1.26%
jan 1, 2004
6.306 mln
+81.024K
1.3%
jan 1, 2005
6.396 mln
+89.635K
1.42%
jan 1, 2006
6.497 mln
+101.372K
1.59%
jan 1, 2007
6.612 mln
+115.554K
1.78%
jan 1, 2008
6.742 mln
+129.219K
1.95%
jan 1, 2009
6.882 mln
+139.854K
2.07%
jan 1, 2010
7.027 mln
+145.225K
2.11%
jan 1, 2011
7.174 mln
+147.163K
2.09%
jan 1, 2012
7.322 mln
+148.097K
2.06%
jan 1, 2013
7.472 mln
+149.696K
2.04%
jan 1, 2014
7.622 mln
+150.497K
2.01%
jan 1, 2015
7.773 mln
+150.652K
1.98%
jan 1, 2016
7.923 mln
+150.248K
1.93%
Ranking of countries by current statistics by years


Comments: