29
/
en
AIzaSyAYiBZKx7MnpbEhh9jyipgxe19OcubqV5w
April 1, 2024
148570
Guyana
GUY
true
2
1
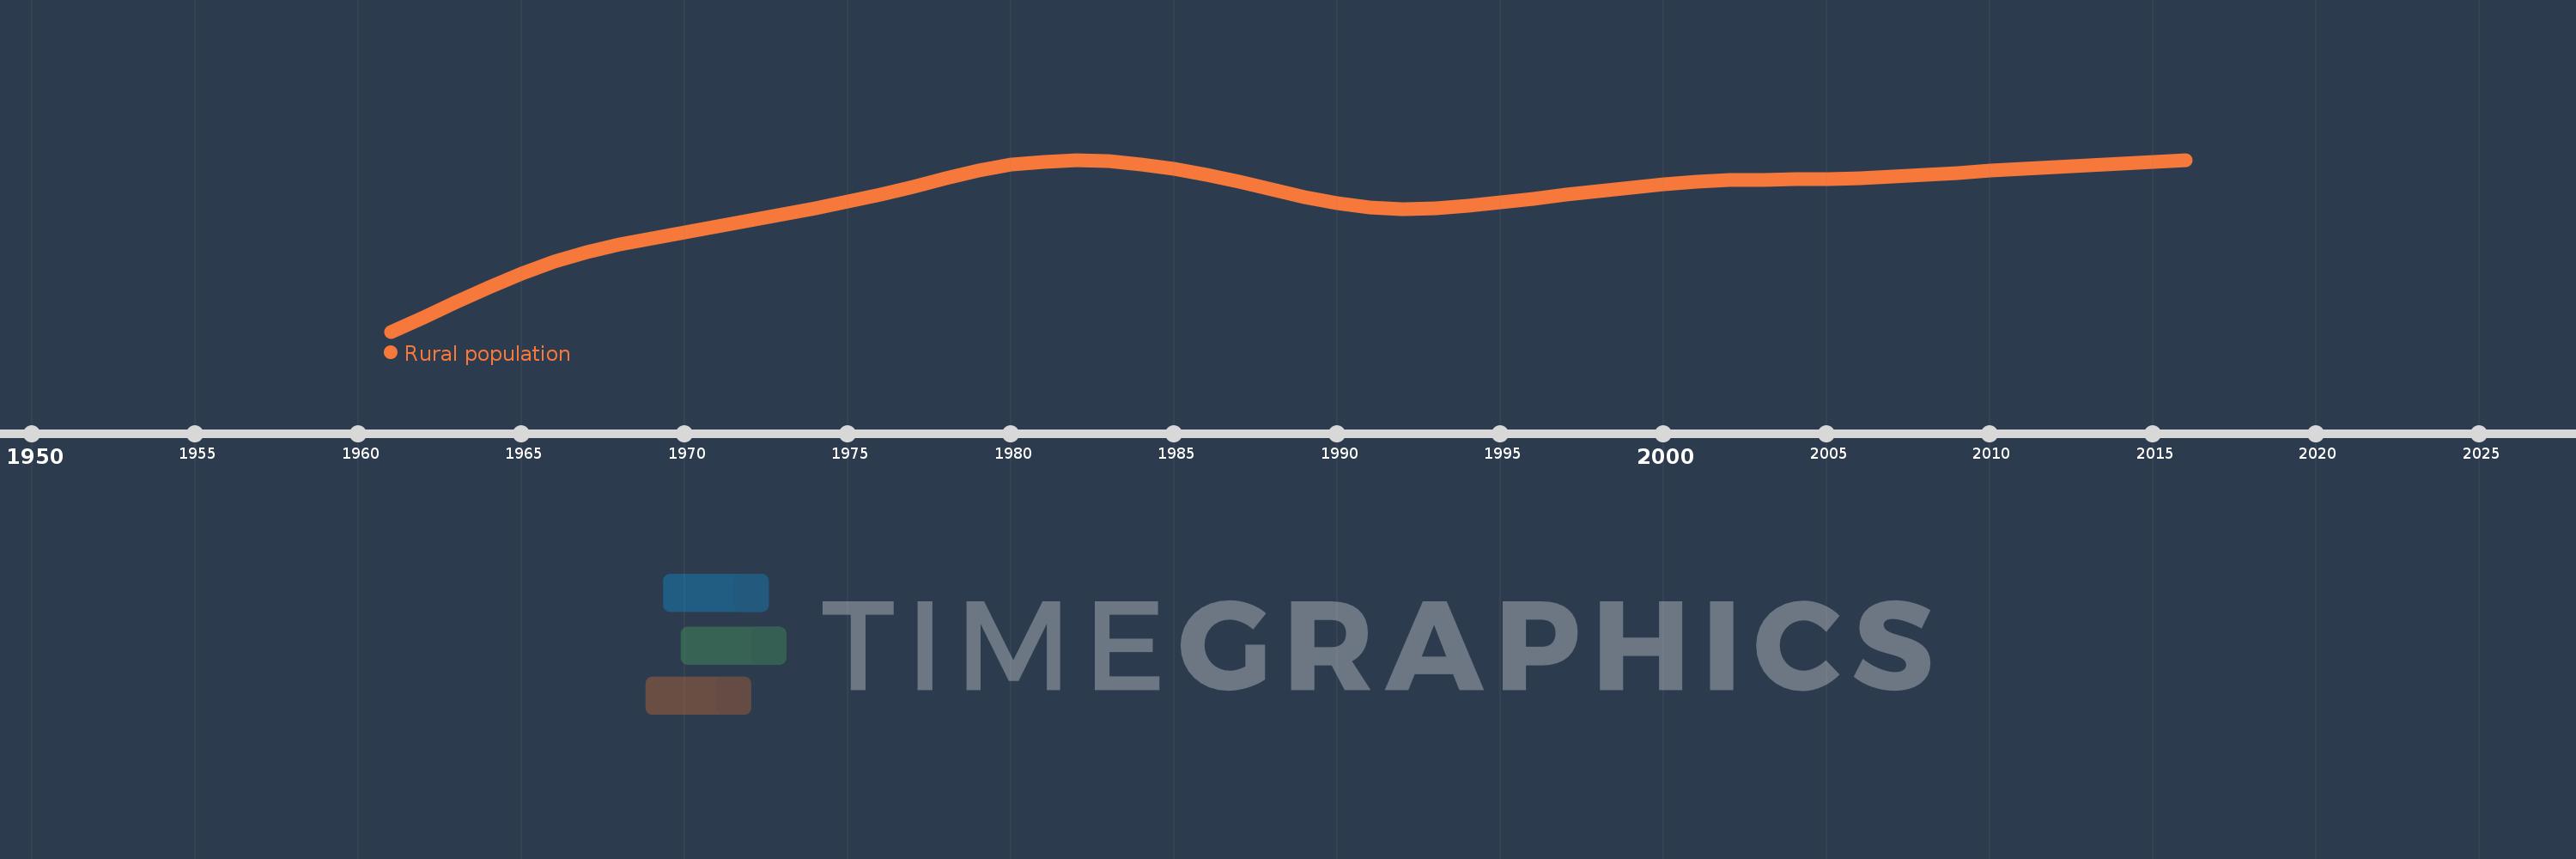
Rural population
2016,2015,2014,2013,2012,2011,2010,2009,2008,2007,2006,2005,2004,2003,2002,2001,2000,1999,1998,1997,1996,1995,1994,1993,1992,1991,1990,1989,1988,1987,1986,1985,1984,1983,1982,1981,1980,1979,1978,1977,1976,1975,1974,1973,1972,1971,1970,1969,1968,1967,1966,1965,1964,1963,1962,1961
This statistics in other country:
AfghanistanAlbaniaAlgeriaAmerican SamoaAndorraAngolaAntigua and BarbudaArab WorldArgentinaArmeniaArubaAustraliaAustriaAzerbaijanBahamas, TheBahrainBangladeshBarbadosBelarusBelgiumBelizeBeninBermudaBhutanBoliviaBosnia and HerzegovinaBotswanaBrazilBritish Virgin IslandsBrunei DarussalamBulgariaBurkina FasoBurundiCabo VerdeCambodiaCameroonCanadaCaribbean small statesCayman IslandsCentral African RepublicCentral Europe and the BalticsChadChannel IslandsChileChinaColombiaComorosCongo, Dem. Rep.Congo, Rep.Costa RicaCote d'IvoireCroatiaCubaCuracaoCyprusCzech RepublicDenmarkDjiboutiDominicaDominican RepublicEarly-demographic dividendEast Asia & PacificEast Asia & Pacific (excluding high income)East Asia & Pacific (IDA & IBRD countries)EcuadorEgypt, Arab Rep.El SalvadorEquatorial GuineaEritreaEstoniaEthiopiaEuro areaEurope & Central AsiaEurope & Central Asia (excluding high income)Europe & Central Asia (IDA & IBRD countries)European UnionFaroe IslandsFijiFinlandFragile and conflict affected situationsFranceFrench PolynesiaGabonGambia, TheGeorgiaGermanyGhanaGibraltarGreeceGreenlandGrenadaGuamGuatemalaGuineaGuinea-BissauGuyanaHaitiHeavily indebted poor countries (HIPC)High incomeHondurasHong Kong SAR, ChinaHungaryIBRD onlyIcelandIDA & IBRD totalIDA blendIDA onlyIDA totalIndiaIndonesiaIran, Islamic Rep.IraqIrelandIsle of ManIsraelItalyJamaicaJapanJordanKazakhstanKenyaKiribatiKorea, Dem. People’s Rep.Korea, Rep.KuwaitKyrgyz RepublicLao PDRLate-demographic dividendLatin America & Caribbean Latin America & Caribbean (excluding high income)Latin America & the Caribbean (IDA & IBRD countries)LatviaLeast developed countries: UN classificationLebanonLesothoLiberiaLibyaLiechtensteinLithuaniaLow & middle incomeLow incomeLower middle incomeLuxembourgMacao SAR, ChinaMacedonia, FYRMadagascarMalawiMalaysiaMaldivesMaliMaltaMarshall IslandsMauritaniaMauritiusMexicoMicronesia, Fed. Sts.Middle East & North AfricaMiddle East & North Africa (excluding high income)Middle East & North Africa (IDA & IBRD countries)Middle incomeMoldovaMonacoMongoliaMontenegroMoroccoMozambiqueMyanmarNamibiaNauruNepalNetherlandsNew CaledoniaNew ZealandNicaraguaNigerNigeriaNorth AmericaNorthern Mariana IslandsNorwayOECD membersOmanOther small statesPacific island small statesPakistanPalauPanamaPapua New GuineaParaguayPeruPhilippinesPolandPortugalPost-demographic dividendPre-demographic dividendPuerto RicoQatarRomaniaRussian FederationRwandaSamoaSan MarinoSao Tome and PrincipeSaudi ArabiaSenegalSerbiaSeychellesSierra LeoneSingaporeSint Maarten (Dutch part)Slovak RepublicSloveniaSmall statesSolomon IslandsSomaliaSouth AfricaSouth AsiaSouth Asia (IDA & IBRD)South SudanSpainSri LankaSt. Kitts and NevisSt. LuciaSt. Vincent and the GrenadinesSub-Saharan Africa Sub-Saharan Africa (excluding high income)Sub-Saharan Africa (IDA & IBRD countries)SudanSurinameSwazilandSwedenSwitzerlandSyrian Arab RepublicTajikistanTanzaniaThailandTimor-LesteTogoTongaTrinidad and TobagoTunisiaTurkeyTurkmenistanTurks and Caicos IslandsTuvaluUgandaUkraineUnited Arab EmiratesUnited KingdomUnited StatesUpper middle incomeUruguayUzbekistanVanuatuVenezuela, RBVietnamVirgin Islands (U.S.)West Bank and GazaWorldYemen, Rep.ZambiaZimbabwe Timeline:
This timeline shows a graph from 1961 to 2016 of Guyana. No data until 1960. Number of actual observations by date: 56.
Source name:
World Development Indicators
Source organization:
The data on urban population shares used to estimate rural population come from the United Nations, World Urbanization Prospects. Total population figures are World Bank estimates.
Categories, topics:
Agriculture & Rural Development
Last updated:
apr 23, 2017
Indicators value changes by year
Minimum:
400.547K
jan 1, 1961
Maximum:
548.29K
jan 1, 1982
At the date of observation
Value
Absolute change
Change from previous value
jan 1, 1961
400.547K
+400.547K
0.0%
jan 1, 1962
412.959K
+12.412K
3.1%
jan 1, 1963
425.862K
+12.903K
3.12%
jan 1, 1964
438.611K
+12.749K
2.99%
jan 1, 1965
450.328K
+11.717K
2.67%
jan 1, 1966
460.41K
+10.082K
2.24%
jan 1, 1967
468.607K
+8.197K
1.78%
jan 1, 1968
475.168K
+6.561K
1.4%
jan 1, 1969
480.611K
+5.443K
1.15%
jan 1, 1970
485.7K
+5.089K
1.06%
jan 1, 1971
490.892K
+5.192K
1.07%
jan 1, 1972
495.954K
+5.062K
1.03%
jan 1, 1973
501.088K
+5.134K
1.04%
jan 1, 1974
506.446K
+5.358K
1.07%
jan 1, 1975
512.196K
+5.75K
1.14%
jan 1, 1976
518.361K
+6.165K
1.2%
jan 1, 1977
525.135K
+6.774K
1.31%
jan 1, 1978
532.293K
+7.158K
1.36%
jan 1, 1979
538.978K
+6.685K
1.26%
jan 1, 1980
544.008K
+5.03K
0.93%
jan 1, 1981
546.791K
+2.783K
0.51%
jan 1, 1982
548.29K
+1.499K
0.27%
jan 1, 1983
547.431K
-859.0
-0.16%
jan 1, 1984
544.579K
-2.852K
-0.52%
jan 1, 1985
540.353K
-4.226K
-0.78%
jan 1, 1986
535.278K
-5.075K
-0.94%
jan 1, 1987
529.349K
-5.929K
-1.11%
jan 1, 1988
522.7K
-6.649K
-1.26%
jan 1, 1989
516.152K
-6.548K
-1.25%
jan 1, 1990
510.741K
-5.411K
-1.05%
jan 1, 1991
507.201K
-3.54K
-0.69%
jan 1, 1992
505.889K
-1.312K
-0.26%
jan 1, 1993
506.612K
+723.0
0.14%
jan 1, 1994
508.868K
+2.256K
0.45%
jan 1, 1995
511.859K
+2.991K
0.59%
jan 1, 1996
514.958K
+3.099K
0.61%
jan 1, 1997
518.087K
+3.129K
0.61%
jan 1, 1998
521.337K
+3.25K
0.63%
jan 1, 1999
524.445K
+3.108K
0.6%
jan 1, 2000
527.148K
+2.703K
0.52%
jan 1, 2001
529.246K
+2.098K
0.4%
jan 1, 2002
530.574K
+1.328K
0.25%
jan 1, 2003
531.188K
+614.0
0.12%
jan 1, 2004
531.426K
+238.0
0.04%
jan 1, 2005
531.7K
+274.0
0.05%
jan 1, 2006
532.361K
+661.0
0.12%
jan 1, 2007
533.549K
+1.188K
0.22%
jan 1, 2008
535.137K
+1.588K
0.3%
jan 1, 2009
536.998K
+1.861K
0.35%
jan 1, 2010
538.88K
+1.882K
0.35%
jan 1, 2011
540.62K
+1.74K
0.32%
jan 1, 2012
542.187K
+1.567K
0.29%
jan 1, 2013
543.636K
+1.449K
0.27%
jan 1, 2014
545.037K
+1.401K
0.26%
jan 1, 2015
546.497K
+1.46K
0.27%
jan 1, 2016
548.059K
+1.562K
0.29%
Ranking of countries by current statistics by years


Comments: