29
/
en
AIzaSyAYiBZKx7MnpbEhh9jyipgxe19OcubqV5w
April 1, 2024
83572
Belize
BLZ
true
2
1
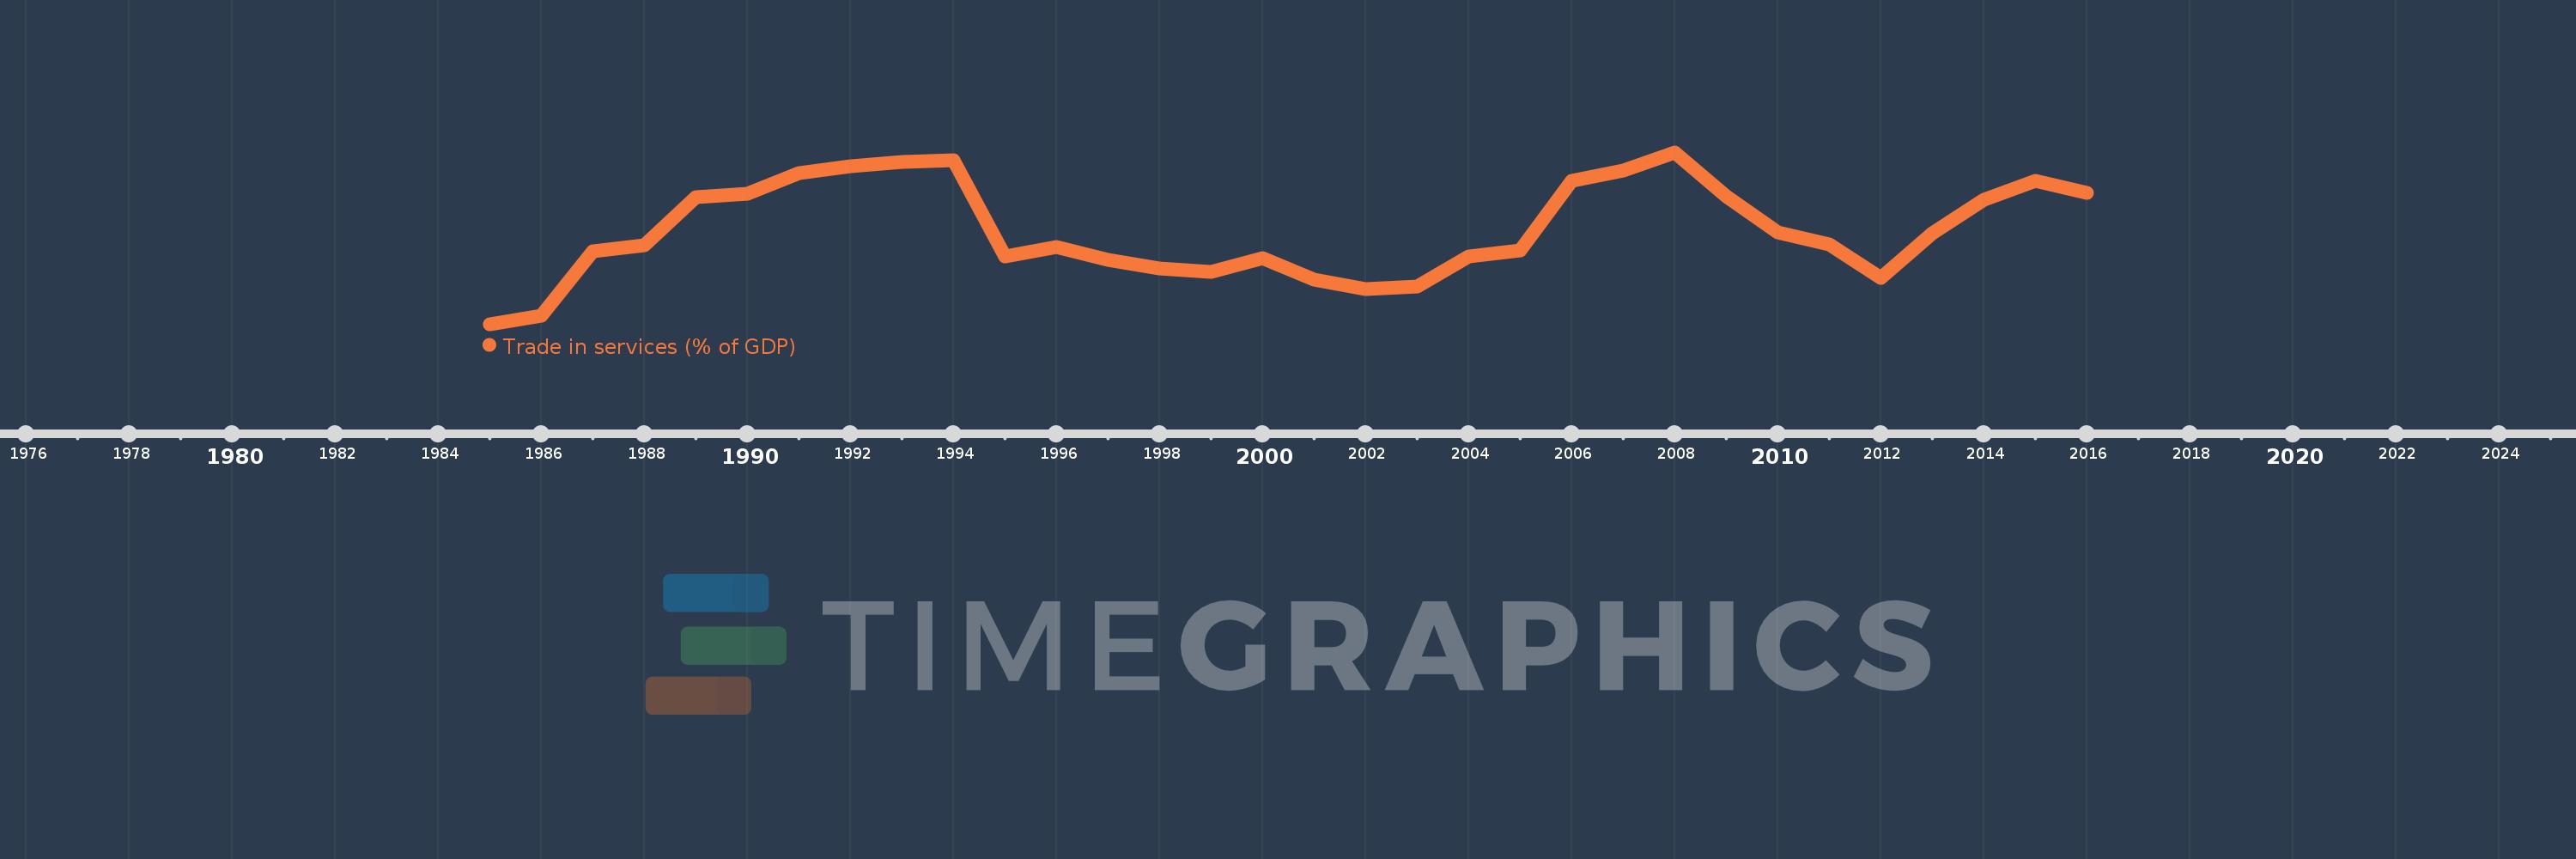
Trade in services (% of GDP)
2016,2015,2014,2013,2012,2011,2010,2009,2008,2007,2006,2005,2004,2003,2002,2001,2000,1999,1998,1997,1996,1995,1994,1993,1992,1991,1990,1989,1988,1987,1986,1985
This statistics in other country:
AfghanistanAlbaniaAlgeriaAngolaAntigua and BarbudaArab WorldArgentinaArmeniaArubaAustraliaAustriaAzerbaijanBahamas, TheBahrainBangladeshBarbadosBelarusBelgiumBelizeBeninBermudaBhutanBoliviaBosnia and HerzegovinaBotswanaBrazilBrunei DarussalamBulgariaBurkina FasoBurundiCabo VerdeCambodiaCameroonCanadaCaribbean small statesCentral African RepublicCentral Europe and the BalticsChadChileChinaColombiaComorosCongo, Dem. Rep.Congo, Rep.Costa RicaCote d'IvoireCroatiaCyprusCzech RepublicDenmarkDjiboutiDominicaDominican RepublicEarly-demographic dividendEast Asia & PacificEast Asia & Pacific (excluding high income)East Asia & Pacific (IDA & IBRD countries)EcuadorEgypt, Arab Rep.El SalvadorEquatorial GuineaEritreaEstoniaEthiopiaEuro areaEurope & Central AsiaEurope & Central Asia (excluding high income)Europe & Central Asia (IDA & IBRD countries)European UnionFaroe IslandsFijiFinlandFragile and conflict affected situationsFranceGabonGambia, TheGeorgiaGermanyGhanaGreeceGrenadaGuatemalaGuineaGuinea-BissauGuyanaHaitiHeavily indebted poor countries (HIPC)High incomeHondurasHong Kong SAR, ChinaHungaryIBRD onlyIcelandIDA & IBRD totalIDA blendIDA onlyIDA totalIndiaIndonesiaIran, Islamic Rep.IraqIrelandIsraelItalyJamaicaJapanJordanKazakhstanKenyaKiribatiKorea, Rep.KosovoKuwaitKyrgyz RepublicLao PDRLate-demographic dividendLatin America & Caribbean Latin America & Caribbean (excluding high income)Latin America & the Caribbean (IDA & IBRD countries)LatviaLeast developed countries: UN classificationLebanonLesothoLiberiaLibyaLithuaniaLow & middle incomeLow incomeLower middle incomeLuxembourgMacao SAR, ChinaMacedonia, FYRMadagascarMalawiMalaysiaMaldivesMaliMaltaMarshall IslandsMauritaniaMauritiusMexicoMicronesia, Fed. Sts.Middle East & North AfricaMiddle East & North Africa (excluding high income)Middle East & North Africa (IDA & IBRD countries)Middle incomeMoldovaMongoliaMontenegroMoroccoMozambiqueMyanmarNamibiaNepalNetherlandsNew ZealandNicaraguaNigerNigeriaNorth AmericaNorwayOECD membersOmanOther small statesPacific island small statesPakistanPalauPanamaPapua New GuineaParaguayPeruPhilippinesPolandPortugalPost-demographic dividendPre-demographic dividendQatarRomaniaRussian FederationRwandaSamoaSao Tome and PrincipeSaudi ArabiaSenegalSerbiaSeychellesSierra LeoneSingaporeSlovak RepublicSloveniaSmall statesSolomon IslandsSouth AfricaSouth AsiaSouth Asia (IDA & IBRD)South SudanSpainSri LankaSt. Kitts and NevisSt. LuciaSt. Vincent and the GrenadinesSub-Saharan Africa Sub-Saharan Africa (excluding high income)Sub-Saharan Africa (IDA & IBRD countries)SudanSurinameSwazilandSwedenSwitzerlandSyrian Arab RepublicTajikistanTanzaniaThailandTimor-LesteTogoTongaTrinidad and TobagoTunisiaTurkeyTuvaluUgandaUkraineUnited KingdomUnited StatesUpper middle incomeUruguayVanuatuVenezuela, RBVietnamWest Bank and GazaWorldYemen, Rep.ZambiaZimbabwe Timeline:
This timeline shows a graph from 1985 to 2016 of Belize. No data until 1984. Number of actual observations by date: 32.
Source name:
World Development Indicators
Source organization:
International Monetary Fund, Balance of Payments Statistics Yearbook and data files, and World Bank and OECD GDP estimates.
Categories, topics:
Economy & Growth, Private Sector, Trade
Last updated:
apr 23, 2017
Indicators value changes by year
Minimum:
30.725
jan 1, 1985
At the date of observation
Value
Absolute change
Change from previous value
jan 1, 1985
30.725
+30.725
0.0%
jan 1, 1986
31.389
+0.663
2.16%
jan 1, 1987
36.406
+5.017
15.98%
jan 1, 1988
36.847
+0.441
1.21%
jan 1, 1989
40.584
+3.737
10.14%
jan 1, 1990
40.851
+0.267
0.66%
jan 1, 1991
42.452
+1.602
3.92%
jan 1, 1992
42.926
+0.473
1.11%
jan 1, 1993
43.262
+0.336
0.78%
jan 1, 1994
43.404
+0.142
0.33%
jan 1, 1995
36.0
-7.404
-17.06%
jan 1, 1996
36.718
+0.719
2.0%
jan 1, 1997
35.738
-0.98
-2.67%
jan 1, 1998
35.073
-0.665
-1.86%
jan 1, 1999
34.754
-0.32
-0.91%
jan 1, 2000
35.855
+1.101
3.17%
jan 1, 2001
34.178
-1.677
-4.68%
jan 1, 2002
33.444
-0.733
-2.15%
jan 1, 2003
33.678
+0.234
0.7%
jan 1, 2004
35.999
+2.321
6.89%
jan 1, 2005
36.417
+0.417
1.16%
jan 1, 2006
41.8
+5.383
14.78%
jan 1, 2007
42.646
+0.846
2.02%
jan 1, 2008
44.03
+1.385
3.25%
jan 1, 2009
40.608
-3.422
-7.77%
jan 1, 2010
37.81
-2.798
-6.89%
jan 1, 2011
36.917
-0.893
-2.36%
jan 1, 2012
34.339
-2.578
-6.98%
jan 1, 2013
37.782
+3.443
10.03%
jan 1, 2014
40.339
+2.557
6.77%
jan 1, 2015
41.849
+1.51
3.74%
jan 1, 2016
40.91
-0.939
-2.24%
Ranking of countries by current statistics by years


Comments: