29
/
en
AIzaSyAYiBZKx7MnpbEhh9jyipgxe19OcubqV5w
April 1, 2024
281779
Venezuela, RB
VEN
true
2
1
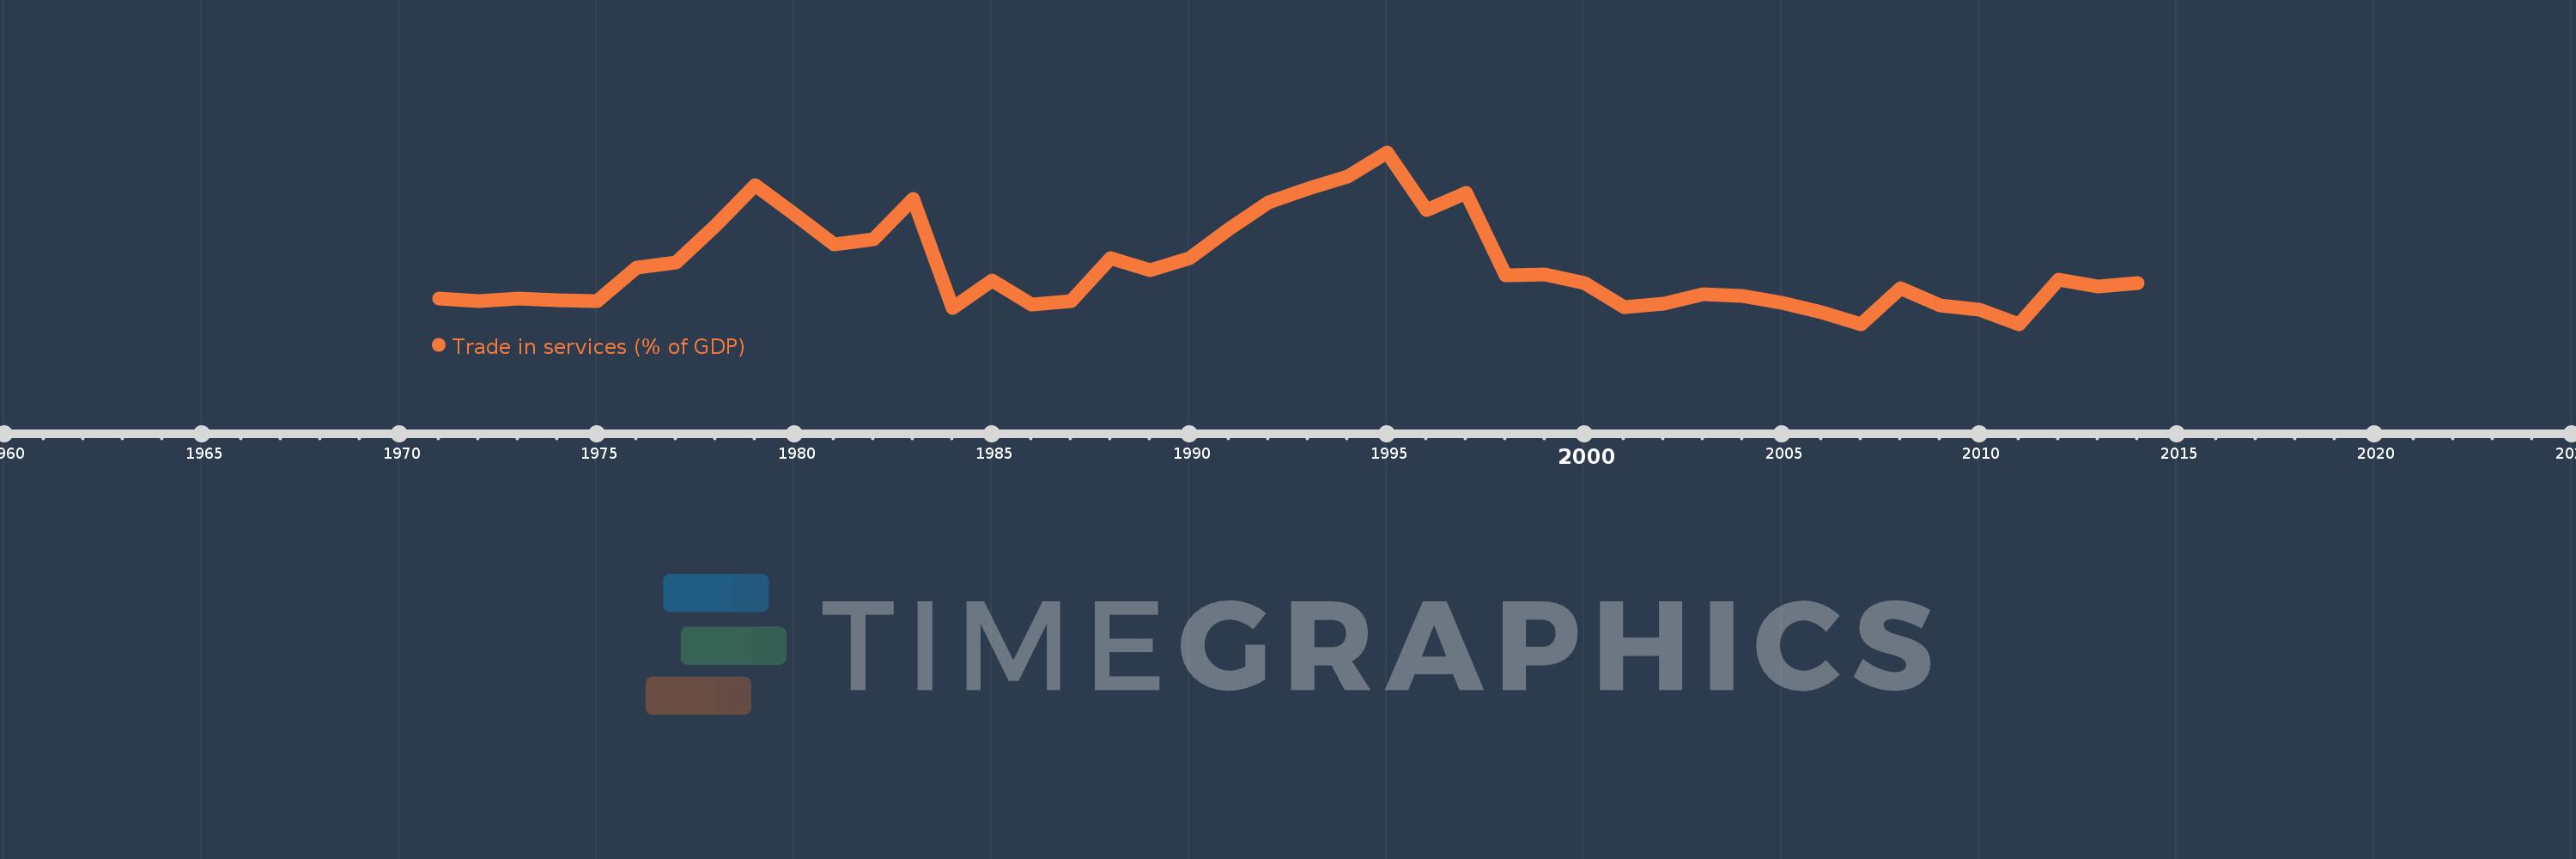
Trade in services (% of GDP)
2014,2013,2012,2011,2010,2009,2008,2007,2006,2005,2004,2003,2002,2001,2000,1999,1998,1997,1996,1995,1994,1993,1992,1991,1990,1989,1988,1987,1986,1985,1984,1983,1982,1981,1980,1979,1978,1977,1976,1975,1974,1973,1972,1971
This statistics in other country:
AfghanistanAlbaniaAlgeriaAngolaAntigua and BarbudaArab WorldArgentinaArmeniaArubaAustraliaAustriaAzerbaijanBahamas, TheBahrainBangladeshBarbadosBelarusBelgiumBelizeBeninBermudaBhutanBoliviaBosnia and HerzegovinaBotswanaBrazilBrunei DarussalamBulgariaBurkina FasoBurundiCabo VerdeCambodiaCameroonCanadaCaribbean small statesCentral African RepublicCentral Europe and the BalticsChadChileChinaColombiaComorosCongo, Dem. Rep.Congo, Rep.Costa RicaCote d'IvoireCroatiaCyprusCzech RepublicDenmarkDjiboutiDominicaDominican RepublicEarly-demographic dividendEast Asia & PacificEast Asia & Pacific (excluding high income)East Asia & Pacific (IDA & IBRD countries)EcuadorEgypt, Arab Rep.El SalvadorEquatorial GuineaEritreaEstoniaEthiopiaEuro areaEurope & Central AsiaEurope & Central Asia (excluding high income)Europe & Central Asia (IDA & IBRD countries)European UnionFaroe IslandsFijiFinlandFragile and conflict affected situationsFranceGabonGambia, TheGeorgiaGermanyGhanaGreeceGrenadaGuatemalaGuineaGuinea-BissauGuyanaHaitiHeavily indebted poor countries (HIPC)High incomeHondurasHong Kong SAR, ChinaHungaryIBRD onlyIcelandIDA & IBRD totalIDA blendIDA onlyIDA totalIndiaIndonesiaIran, Islamic Rep.IraqIrelandIsraelItalyJamaicaJapanJordanKazakhstanKenyaKiribatiKorea, Rep.KosovoKuwaitKyrgyz RepublicLao PDRLate-demographic dividendLatin America & Caribbean Latin America & Caribbean (excluding high income)Latin America & the Caribbean (IDA & IBRD countries)LatviaLeast developed countries: UN classificationLebanonLesothoLiberiaLibyaLithuaniaLow & middle incomeLow incomeLower middle incomeLuxembourgMacao SAR, ChinaMacedonia, FYRMadagascarMalawiMalaysiaMaldivesMaliMaltaMarshall IslandsMauritaniaMauritiusMexicoMicronesia, Fed. Sts.Middle East & North AfricaMiddle East & North Africa (excluding high income)Middle East & North Africa (IDA & IBRD countries)Middle incomeMoldovaMongoliaMontenegroMoroccoMozambiqueMyanmarNamibiaNepalNetherlandsNew ZealandNicaraguaNigerNigeriaNorth AmericaNorwayOECD membersOmanOther small statesPacific island small statesPakistanPalauPanamaPapua New GuineaParaguayPeruPhilippinesPolandPortugalPost-demographic dividendPre-demographic dividendQatarRomaniaRussian FederationRwandaSamoaSao Tome and PrincipeSaudi ArabiaSenegalSerbiaSeychellesSierra LeoneSingaporeSlovak RepublicSloveniaSmall statesSolomon IslandsSouth AfricaSouth AsiaSouth Asia (IDA & IBRD)South SudanSpainSri LankaSt. Kitts and NevisSt. LuciaSt. Vincent and the GrenadinesSub-Saharan Africa Sub-Saharan Africa (excluding high income)Sub-Saharan Africa (IDA & IBRD countries)SudanSurinameSwazilandSwedenSwitzerlandSyrian Arab RepublicTajikistanTanzaniaThailandTimor-LesteTogoTongaTrinidad and TobagoTunisiaTurkeyTuvaluUgandaUkraineUnited KingdomUnited StatesUpper middle incomeUruguayVanuatuVenezuela, RBVietnamWest Bank and GazaWorldYemen, Rep.ZambiaZimbabwe Timeline:
This timeline shows a graph from 1971 to 2014 of Venezuela, RB. No data until 1970. Number of actual observations by date: 44.
Source name:
World Development Indicators
Source organization:
International Monetary Fund, Balance of Payments Statistics Yearbook and data files, and World Bank and OECD GDP estimates.
Categories, topics:
Economy & Growth, Private Sector, Trade
Last updated:
apr 23, 2017
Indicators value changes by year
Maximum:
11.174
jan 1, 1995
At the date of observation
Value
Absolute change
Change from previous value
jan 1, 1971
5.168
+5.168
0.0%
jan 1, 1972
5.073
-0.094
-1.83%
jan 1, 1973
5.175
+0.102
2.0%
jan 1, 1974
5.111
-0.064
-1.23%
jan 1, 1975
5.065
-0.047
-0.92%
jan 1, 1976
6.44
+1.376
27.16%
jan 1, 1977
6.657
+0.217
3.37%
jan 1, 1978
8.184
+1.527
22.94%
jan 1, 1979
9.831
+1.646
20.11%
jan 1, 1980
8.614
-1.217
-12.38%
jan 1, 1981
7.38
-1.234
-14.32%
jan 1, 1982
7.612
+0.232
3.14%
jan 1, 1983
9.262
+1.65
21.68%
jan 1, 1984
4.791
-4.471
-48.27%
jan 1, 1985
5.919
+1.128
23.54%
jan 1, 1986
4.902
-1.017
-17.18%
jan 1, 1987
5.062
+0.16
3.26%
jan 1, 1988
6.841
+1.779
35.15%
jan 1, 1989
6.329
-0.512
-7.48%
jan 1, 1990
6.826
+0.497
7.85%
jan 1, 1991
8.027
+1.201
17.6%
jan 1, 1992
9.136
+1.109
13.82%
jan 1, 1993
9.689
+0.552
6.04%
jan 1, 1994
10.19
+0.502
5.18%
jan 1, 1995
11.174
+0.984
9.66%
jan 1, 1996
8.788
-2.386
-21.35%
jan 1, 1997
9.501
+0.713
8.11%
jan 1, 1998
6.124
-3.377
-35.55%
jan 1, 1999
6.167
+0.043
0.7%
jan 1, 2000
5.798
-0.368
-5.97%
jan 1, 2001
4.822
-0.976
-16.83%
jan 1, 2002
4.938
+0.116
2.4%
jan 1, 2003
5.325
+0.387
7.85%
jan 1, 2004
5.264
-0.061
-1.15%
jan 1, 2005
5.0
-0.264
-5.01%
jan 1, 2006
4.598
-0.402
-8.04%
jan 1, 2007
4.108
-0.49
-10.65%
jan 1, 2008
5.589
+1.481
36.04%
jan 1, 2009
4.899
-0.69
-12.35%
jan 1, 2010
4.703
-0.196
-4.0%
jan 1, 2011
4.11
-0.593
-12.61%
jan 1, 2012
5.941
+1.831
44.56%
jan 1, 2013
5.662
-0.279
-4.7%
jan 1, 2014
5.79
+0.128
2.27%
Ranking of countries by current statistics by years


Comments: