29
/
en
AIzaSyAYiBZKx7MnpbEhh9jyipgxe19OcubqV5w
April 1, 2024
96889
Burundi
BDI
true
2
1
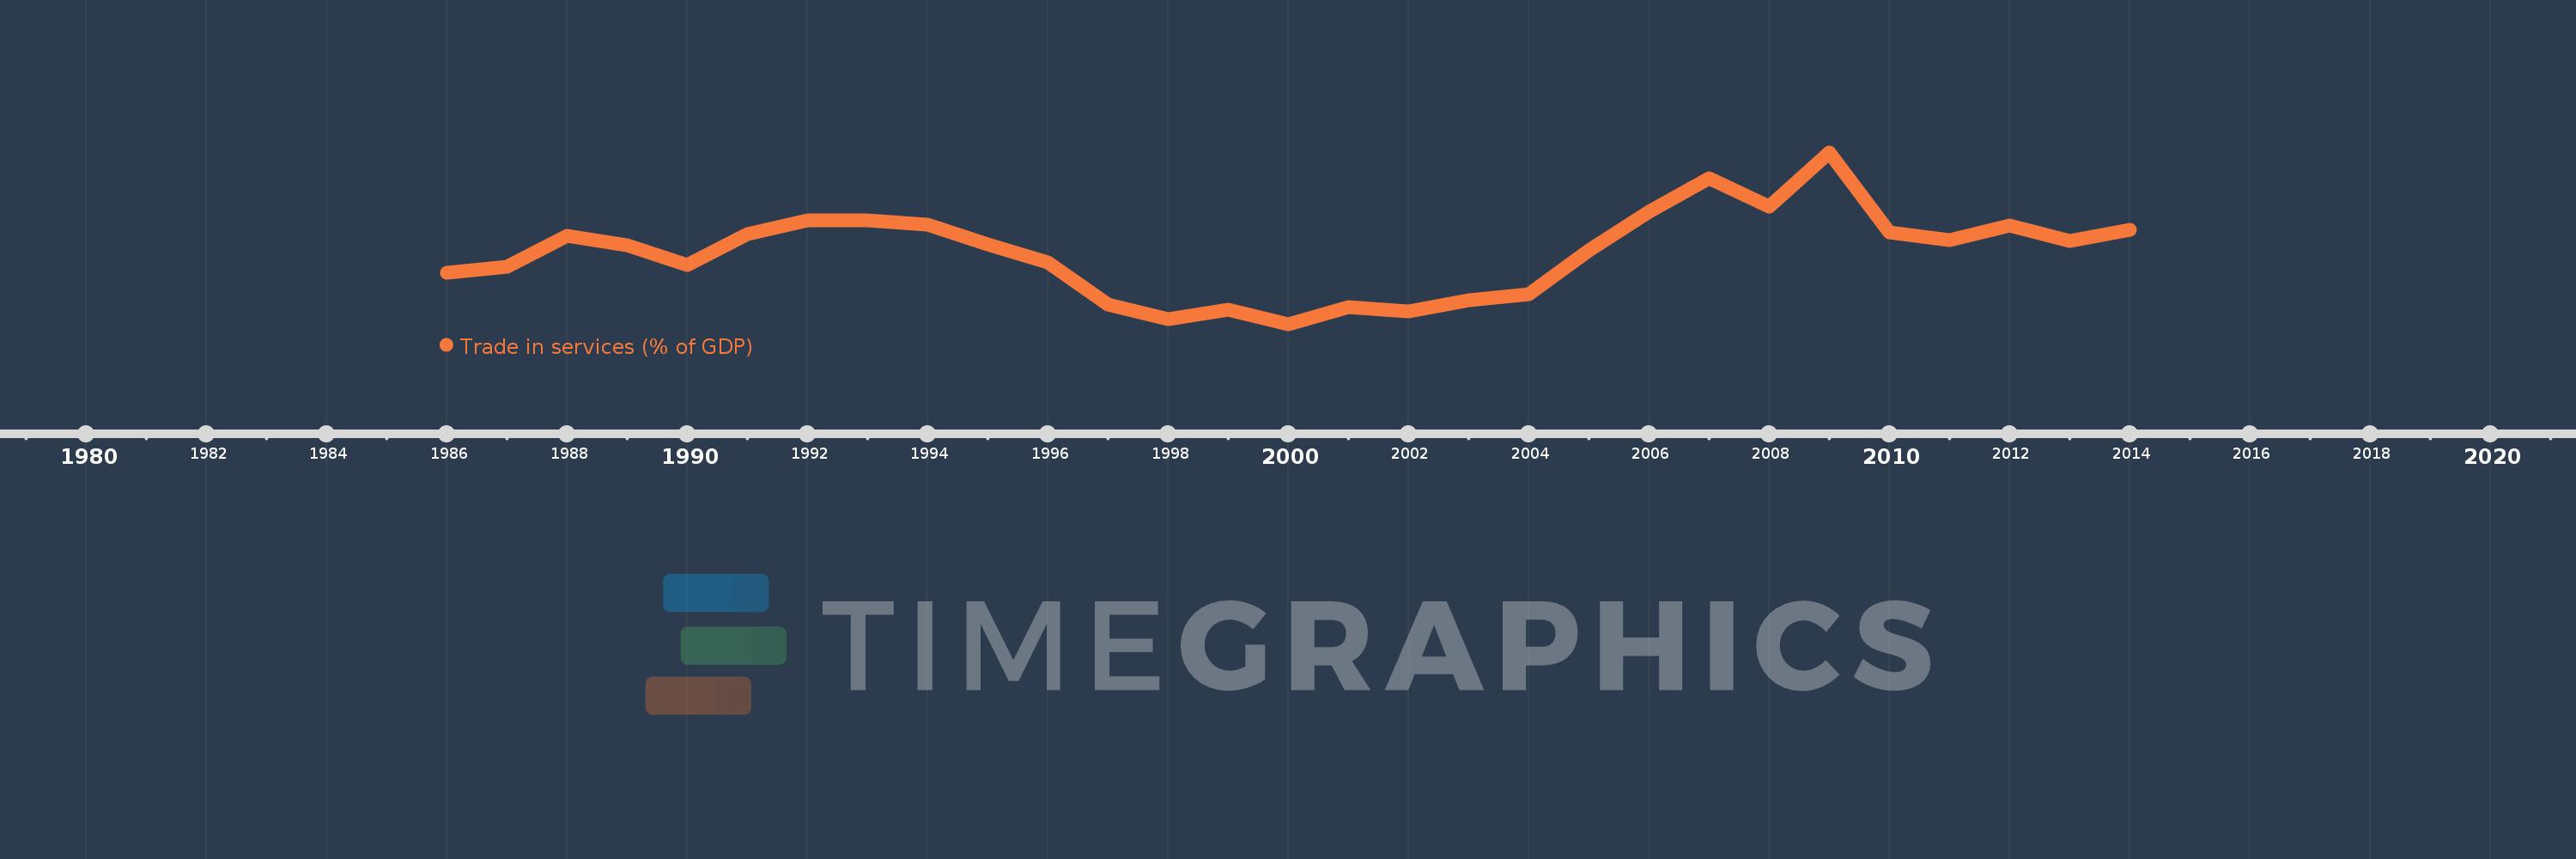
Trade in services (% of GDP)
2014,2013,2012,2011,2010,2009,2008,2007,2006,2005,2004,2003,2002,2001,2000,1999,1998,1997,1996,1995,1994,1993,1992,1991,1990,1989,1988,1987,1986
This statistics in other country:
AfghanistanAlbaniaAlgeriaAngolaAntigua and BarbudaArab WorldArgentinaArmeniaArubaAustraliaAustriaAzerbaijanBahamas, TheBahrainBangladeshBarbadosBelarusBelgiumBelizeBeninBermudaBhutanBoliviaBosnia and HerzegovinaBotswanaBrazilBrunei DarussalamBulgariaBurkina FasoBurundiCabo VerdeCambodiaCameroonCanadaCaribbean small statesCentral African RepublicCentral Europe and the BalticsChadChileChinaColombiaComorosCongo, Dem. Rep.Congo, Rep.Costa RicaCote d'IvoireCroatiaCyprusCzech RepublicDenmarkDjiboutiDominicaDominican RepublicEarly-demographic dividendEast Asia & PacificEast Asia & Pacific (excluding high income)East Asia & Pacific (IDA & IBRD countries)EcuadorEgypt, Arab Rep.El SalvadorEquatorial GuineaEritreaEstoniaEthiopiaEuro areaEurope & Central AsiaEurope & Central Asia (excluding high income)Europe & Central Asia (IDA & IBRD countries)European UnionFaroe IslandsFijiFinlandFragile and conflict affected situationsFranceGabonGambia, TheGeorgiaGermanyGhanaGreeceGrenadaGuatemalaGuineaGuinea-BissauGuyanaHaitiHeavily indebted poor countries (HIPC)High incomeHondurasHong Kong SAR, ChinaHungaryIBRD onlyIcelandIDA & IBRD totalIDA blendIDA onlyIDA totalIndiaIndonesiaIran, Islamic Rep.IraqIrelandIsraelItalyJamaicaJapanJordanKazakhstanKenyaKiribatiKorea, Rep.KosovoKuwaitKyrgyz RepublicLao PDRLate-demographic dividendLatin America & Caribbean Latin America & Caribbean (excluding high income)Latin America & the Caribbean (IDA & IBRD countries)LatviaLeast developed countries: UN classificationLebanonLesothoLiberiaLibyaLithuaniaLow & middle incomeLow incomeLower middle incomeLuxembourgMacao SAR, ChinaMacedonia, FYRMadagascarMalawiMalaysiaMaldivesMaliMaltaMarshall IslandsMauritaniaMauritiusMexicoMicronesia, Fed. Sts.Middle East & North AfricaMiddle East & North Africa (excluding high income)Middle East & North Africa (IDA & IBRD countries)Middle incomeMoldovaMongoliaMontenegroMoroccoMozambiqueMyanmarNamibiaNepalNetherlandsNew ZealandNicaraguaNigerNigeriaNorth AmericaNorwayOECD membersOmanOther small statesPacific island small statesPakistanPalauPanamaPapua New GuineaParaguayPeruPhilippinesPolandPortugalPost-demographic dividendPre-demographic dividendQatarRomaniaRussian FederationRwandaSamoaSao Tome and PrincipeSaudi ArabiaSenegalSerbiaSeychellesSierra LeoneSingaporeSlovak RepublicSloveniaSmall statesSolomon IslandsSouth AfricaSouth AsiaSouth Asia (IDA & IBRD)South SudanSpainSri LankaSt. Kitts and NevisSt. LuciaSt. Vincent and the GrenadinesSub-Saharan Africa Sub-Saharan Africa (excluding high income)Sub-Saharan Africa (IDA & IBRD countries)SudanSurinameSwazilandSwedenSwitzerlandSyrian Arab RepublicTajikistanTanzaniaThailandTimor-LesteTogoTongaTrinidad and TobagoTunisiaTurkeyTuvaluUgandaUkraineUnited KingdomUnited StatesUpper middle incomeUruguayVanuatuVenezuela, RBVietnamWest Bank and GazaWorldYemen, Rep.ZambiaZimbabwe Timeline:
This timeline shows a graph from 1986 to 2014 of Burundi. No data until 1985. Number of actual observations by date: 29.
Source name:
World Development Indicators
Source organization:
International Monetary Fund, Balance of Payments Statistics Yearbook and data files, and World Bank and OECD GDP estimates.
Categories, topics:
Economy & Growth, Private Sector, Trade
Last updated:
apr 23, 2017
Indicators value changes by year
Maximum:
21.227
jan 1, 2009
At the date of observation
Value
Absolute change
Change from previous value
jan 1, 1986
8.911
+8.911
0.0%
jan 1, 1987
9.538
+0.627
7.03%
jan 1, 1988
12.726
+3.188
33.43%
jan 1, 1989
11.715
-1.011
-7.95%
jan 1, 1990
9.689
-2.025
-17.29%
jan 1, 1991
12.888
+3.199
33.01%
jan 1, 1992
14.303
+1.415
10.98%
jan 1, 1993
14.294
-0.009
-0.06%
jan 1, 1994
13.794
-0.5
-3.5%
jan 1, 1995
11.767
-2.027
-14.69%
jan 1, 1996
9.974
-1.793
-15.24%
jan 1, 1997
5.626
-4.349
-43.6%
jan 1, 1998
4.106
-1.519
-27.01%
jan 1, 1999
5.124
+1.018
24.79%
jan 1, 2000
3.628
-1.496
-29.2%
jan 1, 2001
5.354
+1.726
47.57%
jan 1, 2002
4.956
-0.398
-7.43%
jan 1, 2003
6.082
+1.126
22.72%
jan 1, 2004
6.701
+0.619
10.18%
jan 1, 2005
11.188
+4.487
66.97%
jan 1, 2006
15.115
+3.927
35.1%
jan 1, 2007
18.593
+3.478
23.01%
jan 1, 2008
15.702
-2.891
-15.55%
jan 1, 2009
21.227
+5.525
35.19%
jan 1, 2010
13.023
-8.204
-38.65%
jan 1, 2011
12.228
-0.795
-6.1%
jan 1, 2012
13.777
+1.549
12.67%
jan 1, 2013
12.176
-1.601
-11.62%
jan 1, 2014
13.304
+1.128
9.27%
Ranking of countries by current statistics by years


Comments: