29
/
en
AIzaSyAYiBZKx7MnpbEhh9jyipgxe19OcubqV5w
April 1, 2024
37856
IDA & IBRD total
IBT
false
2
1
Trade in services (% of GDP)
2016,2015,2014,2013,2012,2011,2010,2009,2008,2007,2006,2005,2004,2003,2002,2001,2000,1999,1998,1997,1996,1995,1994,1993,1992,1991,1990,1989,1988,1987,1986,1985,1984,1983,1982,1981,1980,1979,1978
This statistics in other country:
AfghanistanAlbaniaAlgeriaAngolaAntigua and BarbudaArab WorldArgentinaArmeniaArubaAustraliaAustriaAzerbaijanBahamas, TheBahrainBangladeshBarbadosBelarusBelgiumBelizeBeninBermudaBhutanBoliviaBosnia and HerzegovinaBotswanaBrazilBrunei DarussalamBulgariaBurkina FasoBurundiCabo VerdeCambodiaCameroonCanadaCaribbean small statesCentral African RepublicCentral Europe and the BalticsChadChileChinaColombiaComorosCongo, Dem. Rep.Congo, Rep.Costa RicaCote d'IvoireCroatiaCyprusCzech RepublicDenmarkDjiboutiDominicaDominican RepublicEarly-demographic dividendEast Asia & PacificEast Asia & Pacific (excluding high income)East Asia & Pacific (IDA & IBRD countries)EcuadorEgypt, Arab Rep.El SalvadorEquatorial GuineaEritreaEstoniaEthiopiaEuro areaEurope & Central AsiaEurope & Central Asia (excluding high income)Europe & Central Asia (IDA & IBRD countries)European UnionFaroe IslandsFijiFinlandFragile and conflict affected situationsFranceGabonGambia, TheGeorgiaGermanyGhanaGreeceGrenadaGuatemalaGuineaGuinea-BissauGuyanaHaitiHeavily indebted poor countries (HIPC)High incomeHondurasHong Kong SAR, ChinaHungaryIBRD onlyIcelandIDA & IBRD totalIDA blendIDA onlyIDA totalIndiaIndonesiaIran, Islamic Rep.IraqIrelandIsraelItalyJamaicaJapanJordanKazakhstanKenyaKiribatiKorea, Rep.KosovoKuwaitKyrgyz RepublicLao PDRLate-demographic dividendLatin America & Caribbean Latin America & Caribbean (excluding high income)Latin America & the Caribbean (IDA & IBRD countries)LatviaLeast developed countries: UN classificationLebanonLesothoLiberiaLibyaLithuaniaLow & middle incomeLow incomeLower middle incomeLuxembourgMacao SAR, ChinaMacedonia, FYRMadagascarMalawiMalaysiaMaldivesMaliMaltaMarshall IslandsMauritaniaMauritiusMexicoMicronesia, Fed. Sts.Middle East & North AfricaMiddle East & North Africa (excluding high income)Middle East & North Africa (IDA & IBRD countries)Middle incomeMoldovaMongoliaMontenegroMoroccoMozambiqueMyanmarNamibiaNepalNetherlandsNew ZealandNicaraguaNigerNigeriaNorth AmericaNorwayOECD membersOmanOther small statesPacific island small statesPakistanPalauPanamaPapua New GuineaParaguayPeruPhilippinesPolandPortugalPost-demographic dividendPre-demographic dividendQatarRomaniaRussian FederationRwandaSamoaSao Tome and PrincipeSaudi ArabiaSenegalSerbiaSeychellesSierra LeoneSingaporeSlovak RepublicSloveniaSmall statesSolomon IslandsSouth AfricaSouth AsiaSouth Asia (IDA & IBRD)South SudanSpainSri LankaSt. Kitts and NevisSt. LuciaSt. Vincent and the GrenadinesSub-Saharan Africa Sub-Saharan Africa (excluding high income)Sub-Saharan Africa (IDA & IBRD countries)SudanSurinameSwazilandSwedenSwitzerlandSyrian Arab RepublicTajikistanTanzaniaThailandTimor-LesteTogoTongaTrinidad and TobagoTunisiaTurkeyTuvaluUgandaUkraineUnited KingdomUnited StatesUpper middle incomeUruguayVanuatuVenezuela, RBVietnamWest Bank and GazaWorldYemen, Rep.ZambiaZimbabwe Timeline:
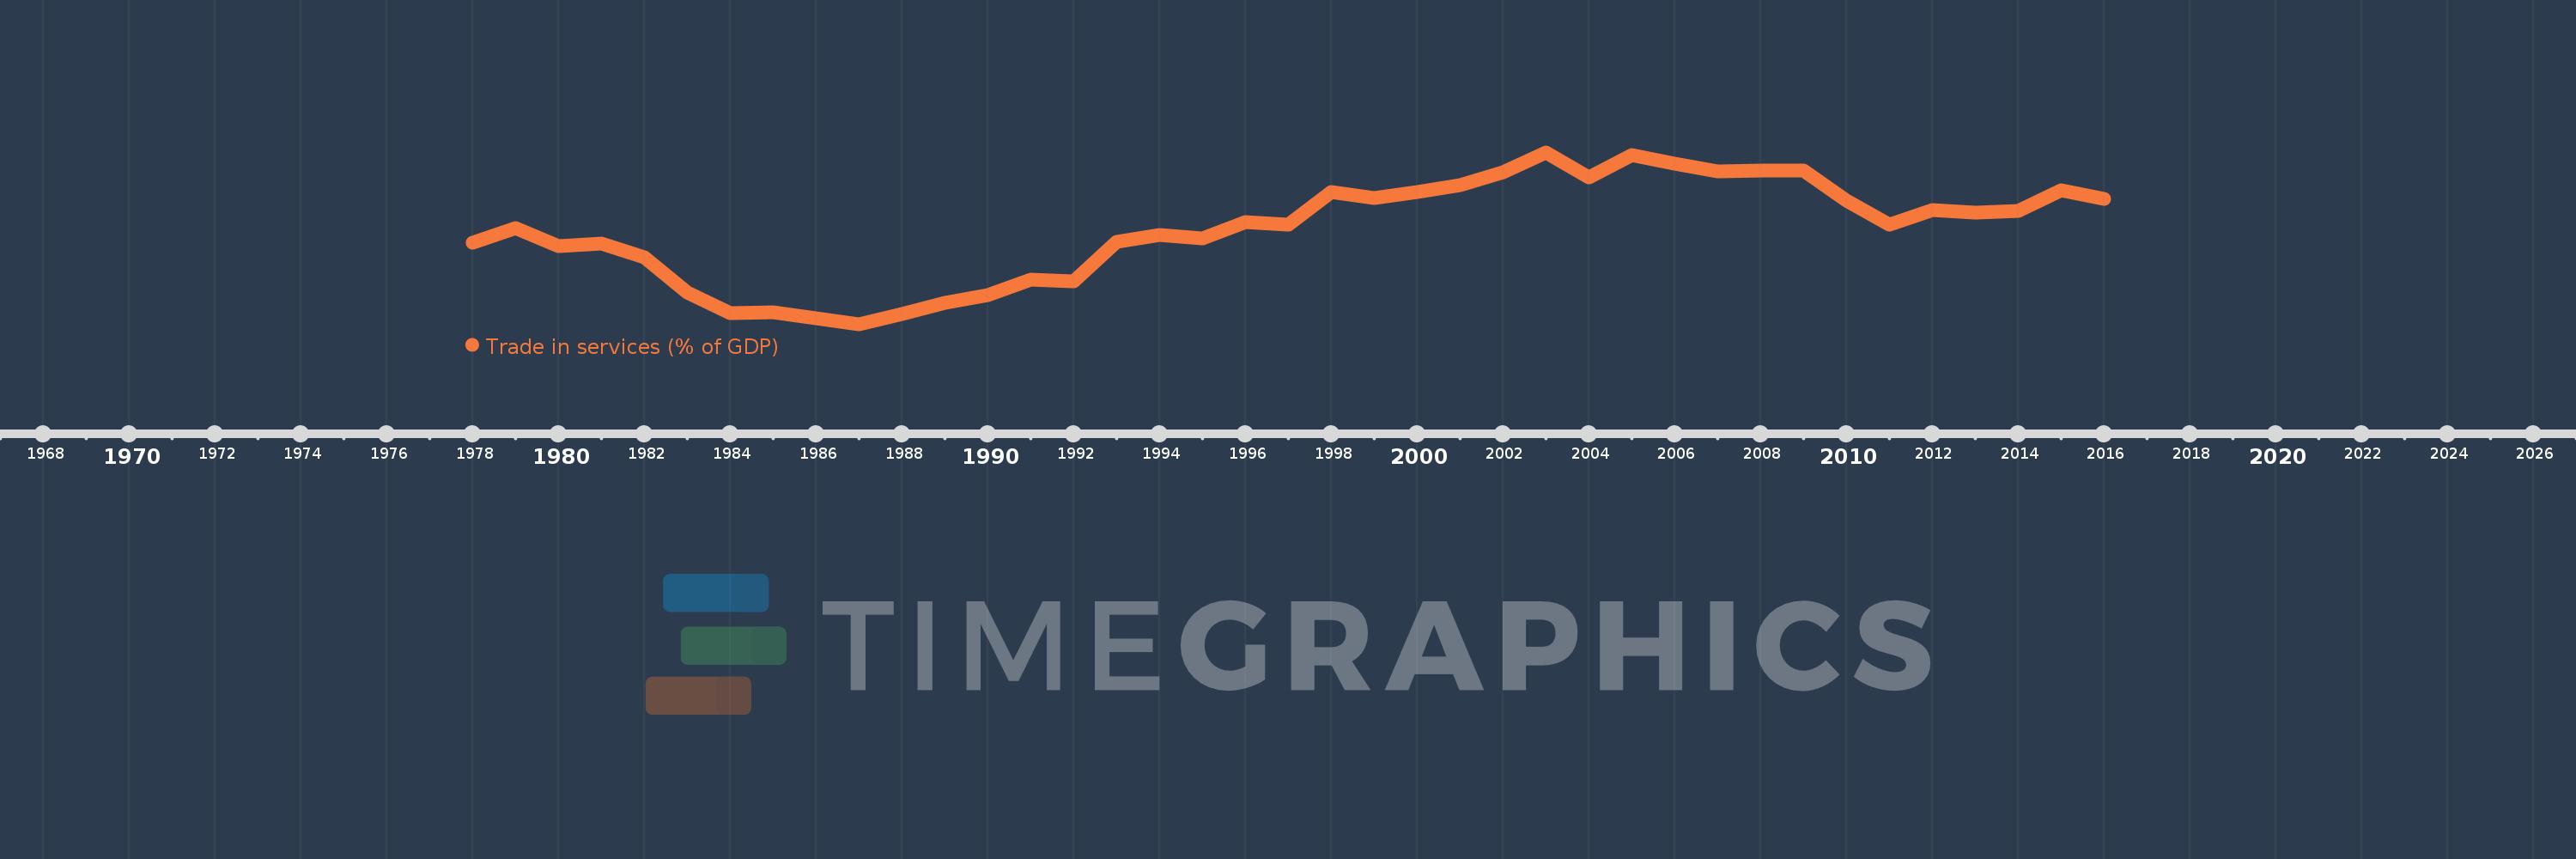
This timeline shows a graph from 1978 to 2016 of IDA & IBRD total. No data until 1977. Number of actual observations by date: 39.
Source name:
World Development Indicators
Source organization:
International Monetary Fund, Balance of Payments Statistics Yearbook and data files, and World Bank and OECD GDP estimates.
Categories, topics:
Economy & Growth, Private Sector, Trade
Last updated:
apr 23, 2017
Indicators value changes by year
Maximum:
10.409
jan 1, 2003
At the date of observation
Value
Absolute change
Change from previous value
jan 1, 1978
7.871
+7.871
0.0%
jan 1, 1979
8.285
+0.414
5.26%
jan 1, 1980
7.764
-0.52
-6.28%
jan 1, 1981
7.846
+0.082
1.05%
jan 1, 1982
7.456
-0.39
-4.97%
jan 1, 1983
6.483
-0.973
-13.05%
jan 1, 1984
5.882
-0.601
-9.27%
jan 1, 1985
5.914
+0.033
0.55%
jan 1, 1986
5.75
-0.164
-2.78%
jan 1, 1987
5.581
-0.169
-2.93%
jan 1, 1988
5.863
+0.282
5.04%
jan 1, 1989
6.181
+0.318
5.42%
jan 1, 1990
6.41
+0.23
3.71%
jan 1, 1991
6.831
+0.42
6.56%
jan 1, 1992
6.779
-0.051
-0.75%
jan 1, 1993
7.891
+1.112
16.4%
jan 1, 1994
8.078
+0.187
2.37%
jan 1, 1995
7.99
-0.088
-1.09%
jan 1, 1996
8.455
+0.465
5.82%
jan 1, 1997
8.372
-0.084
-0.99%
jan 1, 1998
9.289
+0.917
10.95%
jan 1, 1999
9.134
-0.155
-1.67%
jan 1, 2000
9.287
+0.153
1.68%
jan 1, 2001
9.488
+0.2
2.16%
jan 1, 2002
9.844
+0.356
3.75%
jan 1, 2003
10.409
+0.565
5.74%
jan 1, 2004
9.695
-0.714
-6.86%
jan 1, 2005
10.329
+0.634
6.54%
jan 1, 2006
10.096
-0.233
-2.25%
jan 1, 2007
9.875
-0.221
-2.19%
jan 1, 2008
9.902
+0.027
0.28%
jan 1, 2009
9.904
+0.002
0.02%
jan 1, 2010
9.051
-0.853
-8.61%
jan 1, 2011
8.374
-0.677
-7.48%
jan 1, 2012
8.786
+0.412
4.92%
jan 1, 2013
8.727
-0.059
-0.67%
jan 1, 2014
8.76
+0.033
0.38%
jan 1, 2015
9.341
+0.581
6.63%
jan 1, 2016
9.101
-0.24
-2.57%
Ranking of countries by current statistics by years


Comments: