29
/
en
AIzaSyAYiBZKx7MnpbEhh9jyipgxe19OcubqV5w
April 1, 2024
33944
European Union
EUU
false
2
1
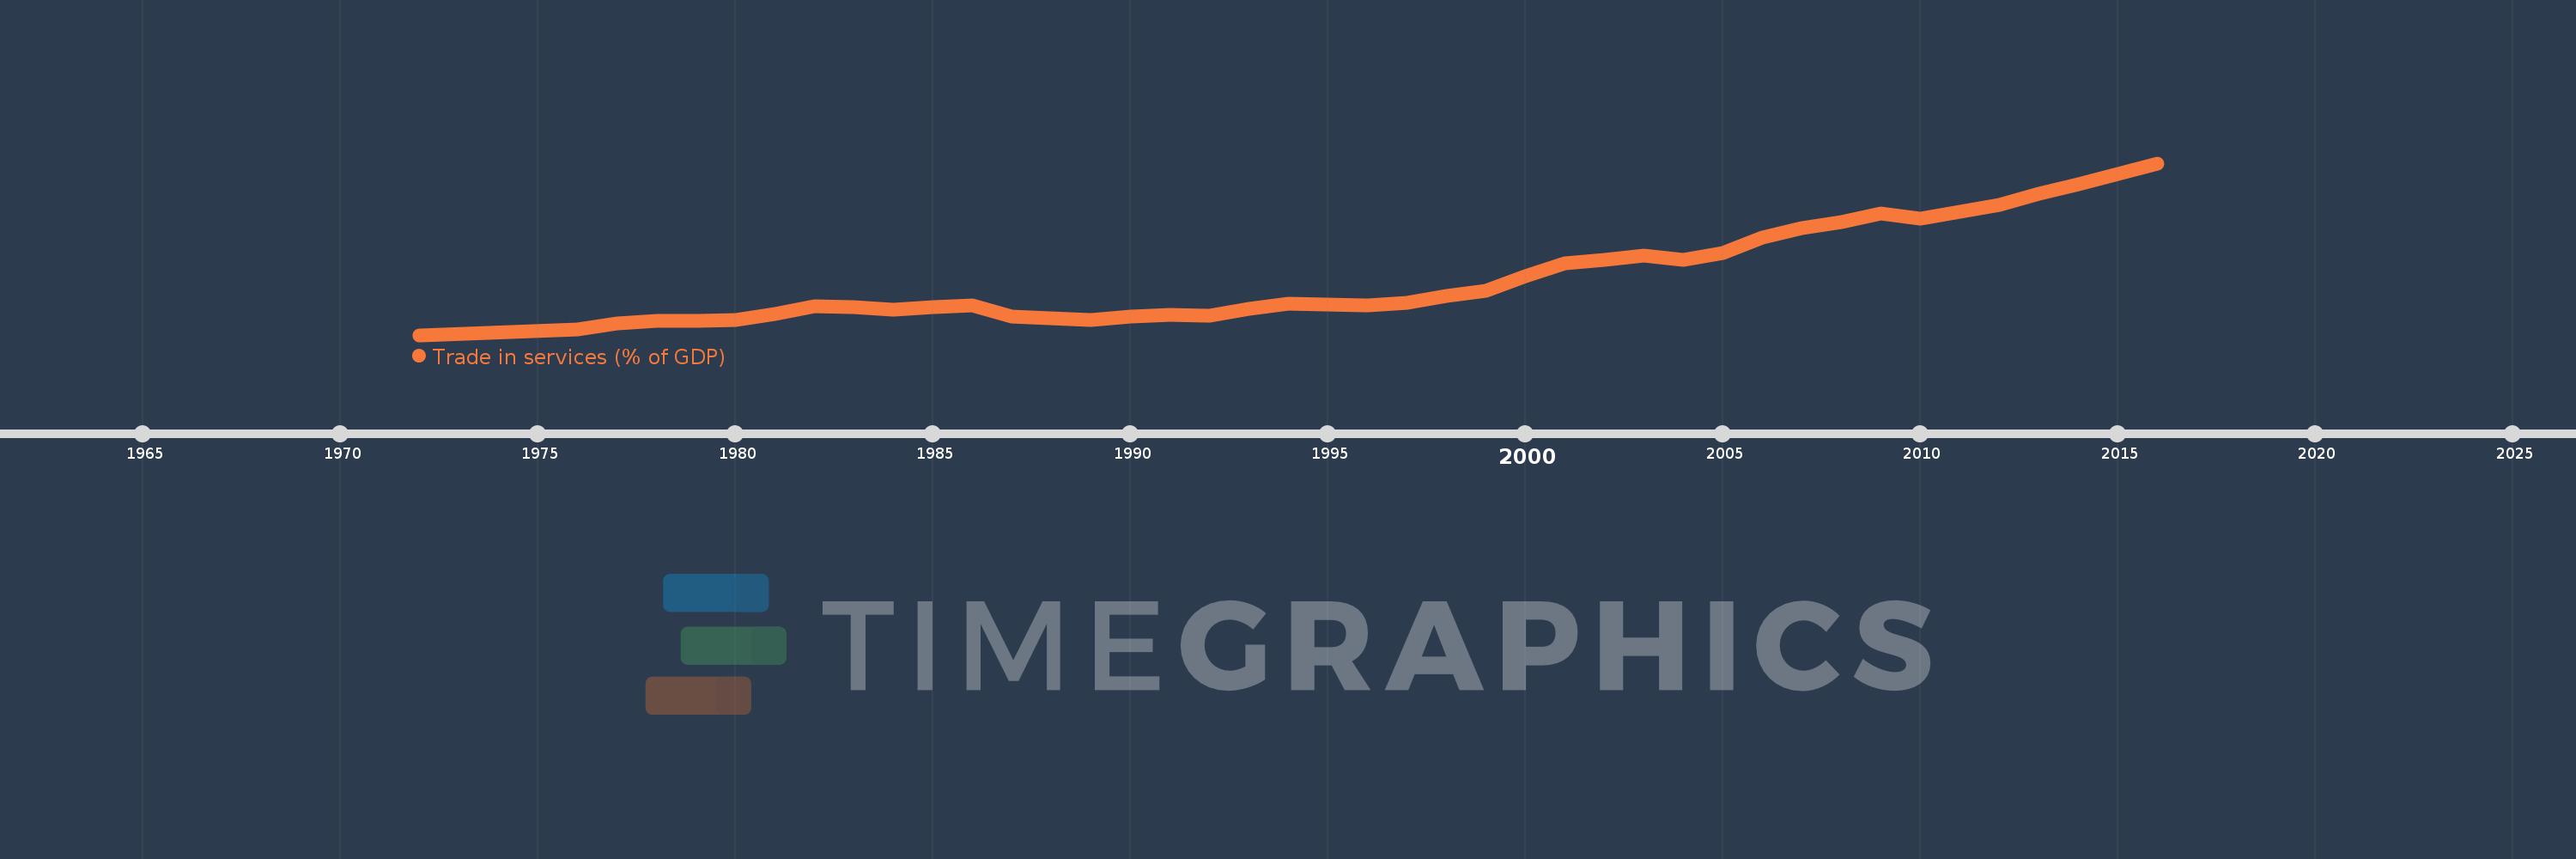
Trade in services (% of GDP)
2016,2015,2014,2013,2012,2011,2010,2009,2008,2007,2006,2005,2004,2003,2002,2001,2000,1999,1998,1997,1996,1995,1994,1993,1992,1991,1990,1989,1988,1987,1986,1985,1984,1983,1982,1981,1980,1979,1978,1977,1976,1972
This statistics in other country:
AfghanistanAlbaniaAlgeriaAngolaAntigua and BarbudaArab WorldArgentinaArmeniaArubaAustraliaAustriaAzerbaijanBahamas, TheBahrainBangladeshBarbadosBelarusBelgiumBelizeBeninBermudaBhutanBoliviaBosnia and HerzegovinaBotswanaBrazilBrunei DarussalamBulgariaBurkina FasoBurundiCabo VerdeCambodiaCameroonCanadaCaribbean small statesCentral African RepublicCentral Europe and the BalticsChadChileChinaColombiaComorosCongo, Dem. Rep.Congo, Rep.Costa RicaCote d'IvoireCroatiaCyprusCzech RepublicDenmarkDjiboutiDominicaDominican RepublicEarly-demographic dividendEast Asia & PacificEast Asia & Pacific (excluding high income)East Asia & Pacific (IDA & IBRD countries)EcuadorEgypt, Arab Rep.El SalvadorEquatorial GuineaEritreaEstoniaEthiopiaEuro areaEurope & Central AsiaEurope & Central Asia (excluding high income)Europe & Central Asia (IDA & IBRD countries)European UnionFaroe IslandsFijiFinlandFragile and conflict affected situationsFranceGabonGambia, TheGeorgiaGermanyGhanaGreeceGrenadaGuatemalaGuineaGuinea-BissauGuyanaHaitiHeavily indebted poor countries (HIPC)High incomeHondurasHong Kong SAR, ChinaHungaryIBRD onlyIcelandIDA & IBRD totalIDA blendIDA onlyIDA totalIndiaIndonesiaIran, Islamic Rep.IraqIrelandIsraelItalyJamaicaJapanJordanKazakhstanKenyaKiribatiKorea, Rep.KosovoKuwaitKyrgyz RepublicLao PDRLate-demographic dividendLatin America & Caribbean Latin America & Caribbean (excluding high income)Latin America & the Caribbean (IDA & IBRD countries)LatviaLeast developed countries: UN classificationLebanonLesothoLiberiaLibyaLithuaniaLow & middle incomeLow incomeLower middle incomeLuxembourgMacao SAR, ChinaMacedonia, FYRMadagascarMalawiMalaysiaMaldivesMaliMaltaMarshall IslandsMauritaniaMauritiusMexicoMicronesia, Fed. Sts.Middle East & North AfricaMiddle East & North Africa (excluding high income)Middle East & North Africa (IDA & IBRD countries)Middle incomeMoldovaMongoliaMontenegroMoroccoMozambiqueMyanmarNamibiaNepalNetherlandsNew ZealandNicaraguaNigerNigeriaNorth AmericaNorwayOECD membersOmanOther small statesPacific island small statesPakistanPalauPanamaPapua New GuineaParaguayPeruPhilippinesPolandPortugalPost-demographic dividendPre-demographic dividendQatarRomaniaRussian FederationRwandaSamoaSao Tome and PrincipeSaudi ArabiaSenegalSerbiaSeychellesSierra LeoneSingaporeSlovak RepublicSloveniaSmall statesSolomon IslandsSouth AfricaSouth AsiaSouth Asia (IDA & IBRD)South SudanSpainSri LankaSt. Kitts and NevisSt. LuciaSt. Vincent and the GrenadinesSub-Saharan Africa Sub-Saharan Africa (excluding high income)Sub-Saharan Africa (IDA & IBRD countries)SudanSurinameSwazilandSwedenSwitzerlandSyrian Arab RepublicTajikistanTanzaniaThailandTimor-LesteTogoTongaTrinidad and TobagoTunisiaTurkeyTuvaluUgandaUkraineUnited KingdomUnited StatesUpper middle incomeUruguayVanuatuVenezuela, RBVietnamWest Bank and GazaWorldYemen, Rep.ZambiaZimbabwe Timeline:
This timeline shows a graph from 1972 to 2016 of European Union. No data until 1971. Number of actual observations by date: 42.
Source name:
World Development Indicators
Source organization:
International Monetary Fund, Balance of Payments Statistics Yearbook and data files, and World Bank and OECD GDP estimates.
Categories, topics:
Economy & Growth, Private Sector, Trade
Last updated:
apr 23, 2017
Indicators value changes by year
Maximum:
22.952
jan 1, 2016
At the date of observation
Value
Absolute change
Change from previous value
jan 1, 1972
8.31
+8.31
0.0%
jan 1, 1976
8.8
+0.49
5.9%
jan 1, 1977
9.327
+0.527
5.99%
jan 1, 1978
9.541
+0.215
2.3%
jan 1, 1979
9.54
-0.002
-0.02%
jan 1, 1980
9.594
+0.055
0.57%
jan 1, 1981
10.08
+0.486
5.06%
jan 1, 1982
10.741
+0.661
6.55%
jan 1, 1983
10.718
-0.022
-0.21%
jan 1, 1984
10.474
-0.244
-2.28%
jan 1, 1985
10.716
+0.242
2.31%
jan 1, 1986
10.871
+0.155
1.45%
jan 1, 1987
9.917
-0.955
-8.78%
jan 1, 1988
9.703
-0.214
-2.16%
jan 1, 1989
9.593
-0.11
-1.13%
jan 1, 1990
9.862
+0.269
2.81%
jan 1, 1991
10.059
+0.196
1.99%
jan 1, 1992
9.933
-0.126
-1.25%
jan 1, 1993
10.518
+0.585
5.89%
jan 1, 1994
10.961
+0.442
4.21%
jan 1, 1995
10.898
-0.063
-0.57%
jan 1, 1996
10.844
-0.053
-0.49%
jan 1, 1997
11.053
+0.209
1.93%
jan 1, 1998
11.675
+0.622
5.62%
jan 1, 1999
12.106
+0.431
3.69%
jan 1, 2000
13.324
+1.218
10.07%
jan 1, 2001
14.425
+1.101
8.26%
jan 1, 2002
14.743
+0.318
2.21%
jan 1, 2003
15.075
+0.332
2.25%
jan 1, 2004
14.685
-0.39
-2.59%
jan 1, 2005
15.313
+0.627
4.27%
jan 1, 2006
16.645
+1.332
8.7%
jan 1, 2007
17.402
+0.758
4.55%
jan 1, 2008
17.912
+0.51
2.93%
jan 1, 2009
18.67
+0.757
4.23%
jan 1, 2010
18.232
-0.437
-2.34%
jan 1, 2011
18.825
+0.593
3.25%
jan 1, 2012
19.421
+0.595
3.16%
jan 1, 2013
20.378
+0.957
4.93%
jan 1, 2014
21.149
+0.772
3.79%
jan 1, 2015
22.015
+0.865
4.09%
jan 1, 2016
22.952
+0.938
4.26%
Ranking of countries by current statistics by years


Comments: