29
/
en
AIzaSyAYiBZKx7MnpbEhh9jyipgxe19OcubqV5w
April 1, 2024
39615
IDA only
IDX
false
2
1
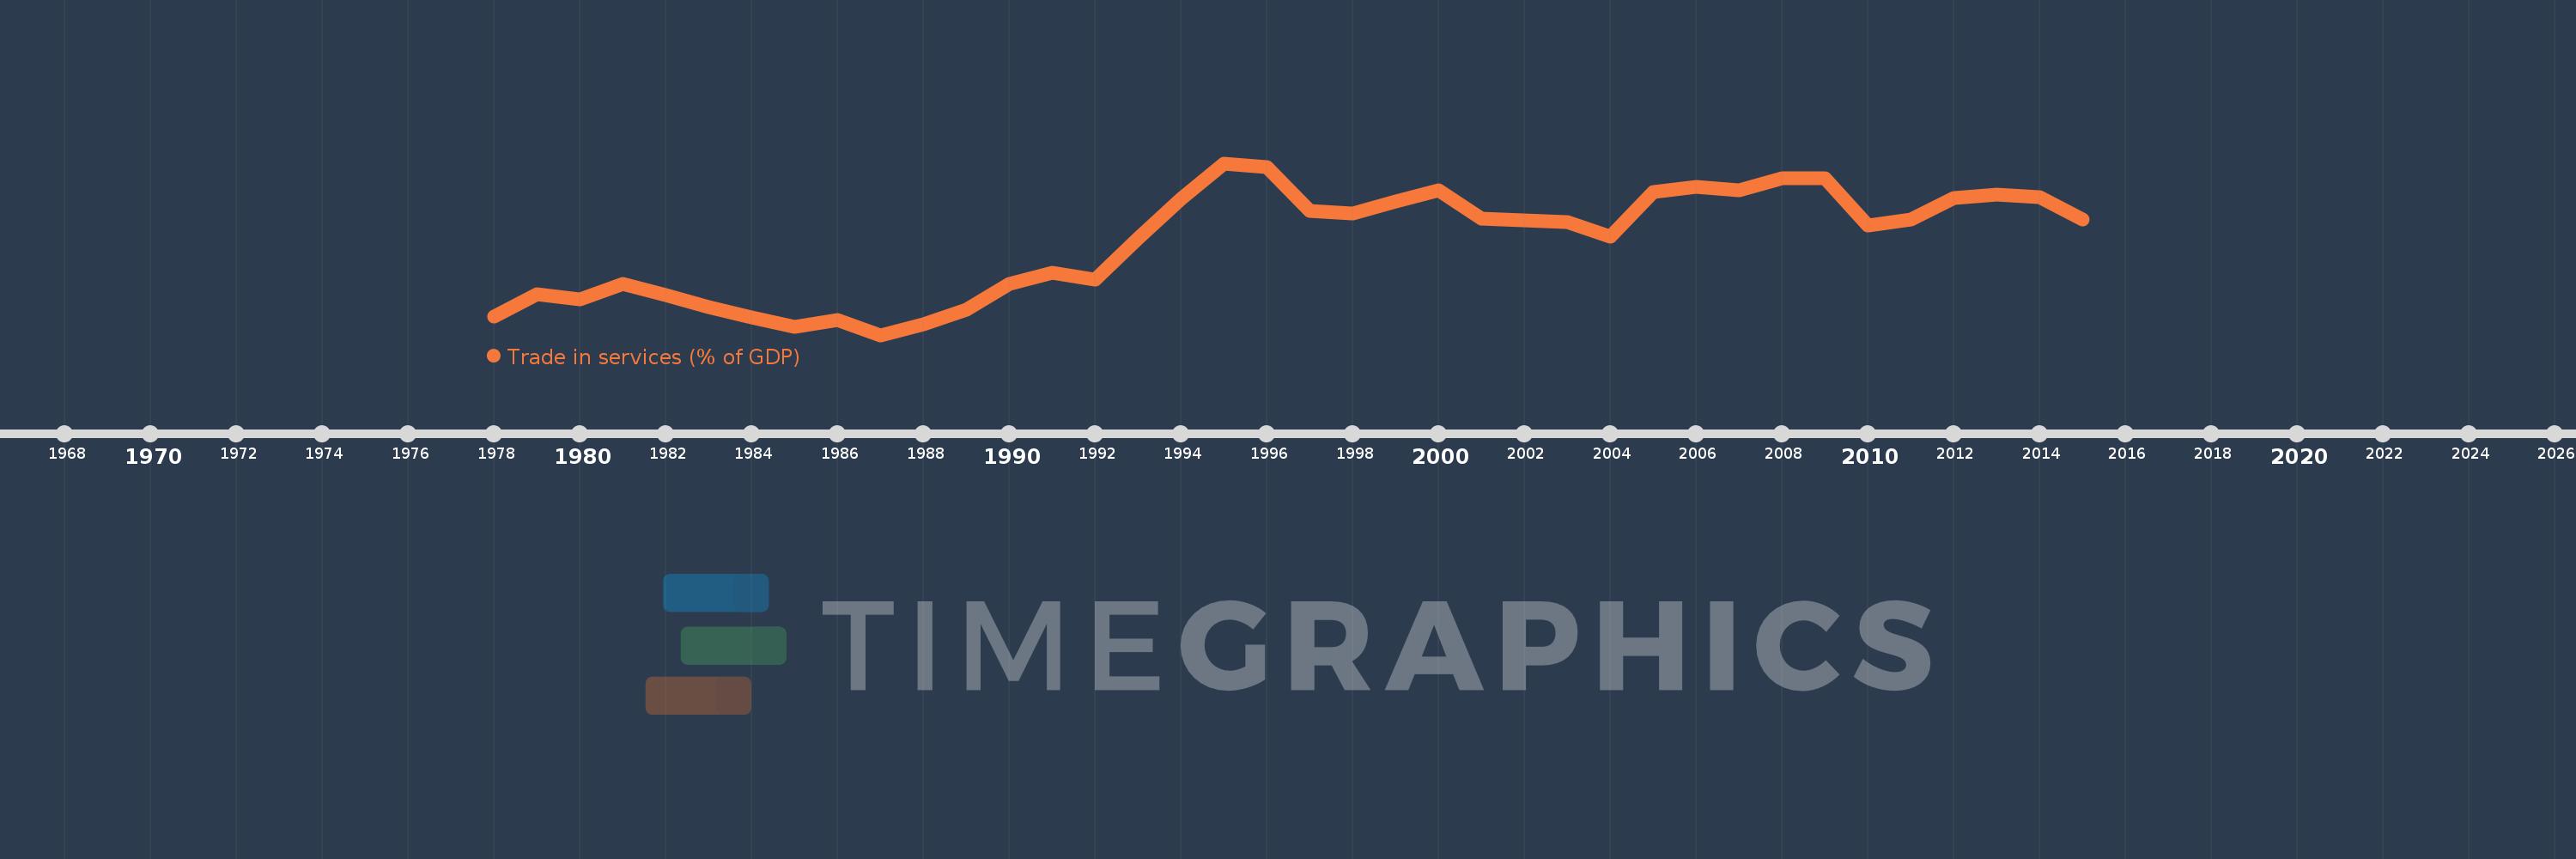
Trade in services (% of GDP)
2015,2014,2013,2012,2011,2010,2009,2008,2007,2006,2005,2004,2003,2002,2001,2000,1999,1998,1997,1996,1995,1994,1993,1992,1991,1990,1989,1988,1987,1986,1985,1984,1983,1982,1981,1980,1979,1978
This statistics in other country:
AfghanistanAlbaniaAlgeriaAngolaAntigua and BarbudaArab WorldArgentinaArmeniaArubaAustraliaAustriaAzerbaijanBahamas, TheBahrainBangladeshBarbadosBelarusBelgiumBelizeBeninBermudaBhutanBoliviaBosnia and HerzegovinaBotswanaBrazilBrunei DarussalamBulgariaBurkina FasoBurundiCabo VerdeCambodiaCameroonCanadaCaribbean small statesCentral African RepublicCentral Europe and the BalticsChadChileChinaColombiaComorosCongo, Dem. Rep.Congo, Rep.Costa RicaCote d'IvoireCroatiaCyprusCzech RepublicDenmarkDjiboutiDominicaDominican RepublicEarly-demographic dividendEast Asia & PacificEast Asia & Pacific (excluding high income)East Asia & Pacific (IDA & IBRD countries)EcuadorEgypt, Arab Rep.El SalvadorEquatorial GuineaEritreaEstoniaEthiopiaEuro areaEurope & Central AsiaEurope & Central Asia (excluding high income)Europe & Central Asia (IDA & IBRD countries)European UnionFaroe IslandsFijiFinlandFragile and conflict affected situationsFranceGabonGambia, TheGeorgiaGermanyGhanaGreeceGrenadaGuatemalaGuineaGuinea-BissauGuyanaHaitiHeavily indebted poor countries (HIPC)High incomeHondurasHong Kong SAR, ChinaHungaryIBRD onlyIcelandIDA & IBRD totalIDA blendIDA onlyIDA totalIndiaIndonesiaIran, Islamic Rep.IraqIrelandIsraelItalyJamaicaJapanJordanKazakhstanKenyaKiribatiKorea, Rep.KosovoKuwaitKyrgyz RepublicLao PDRLate-demographic dividendLatin America & Caribbean Latin America & Caribbean (excluding high income)Latin America & the Caribbean (IDA & IBRD countries)LatviaLeast developed countries: UN classificationLebanonLesothoLiberiaLibyaLithuaniaLow & middle incomeLow incomeLower middle incomeLuxembourgMacao SAR, ChinaMacedonia, FYRMadagascarMalawiMalaysiaMaldivesMaliMaltaMarshall IslandsMauritaniaMauritiusMexicoMicronesia, Fed. Sts.Middle East & North AfricaMiddle East & North Africa (excluding high income)Middle East & North Africa (IDA & IBRD countries)Middle incomeMoldovaMongoliaMontenegroMoroccoMozambiqueMyanmarNamibiaNepalNetherlandsNew ZealandNicaraguaNigerNigeriaNorth AmericaNorwayOECD membersOmanOther small statesPacific island small statesPakistanPalauPanamaPapua New GuineaParaguayPeruPhilippinesPolandPortugalPost-demographic dividendPre-demographic dividendQatarRomaniaRussian FederationRwandaSamoaSao Tome and PrincipeSaudi ArabiaSenegalSerbiaSeychellesSierra LeoneSingaporeSlovak RepublicSloveniaSmall statesSolomon IslandsSouth AfricaSouth AsiaSouth Asia (IDA & IBRD)South SudanSpainSri LankaSt. Kitts and NevisSt. LuciaSt. Vincent and the GrenadinesSub-Saharan Africa Sub-Saharan Africa (excluding high income)Sub-Saharan Africa (IDA & IBRD countries)SudanSurinameSwazilandSwedenSwitzerlandSyrian Arab RepublicTajikistanTanzaniaThailandTimor-LesteTogoTongaTrinidad and TobagoTunisiaTurkeyTuvaluUgandaUkraineUnited KingdomUnited StatesUpper middle incomeUruguayVanuatuVenezuela, RBVietnamWest Bank and GazaWorldYemen, Rep.ZambiaZimbabwe Timeline:
This timeline shows a graph from 1978 to 2015 of IDA only. No data until 1977. Number of actual observations by date: 38.
Source name:
World Development Indicators
Source organization:
International Monetary Fund, Balance of Payments Statistics Yearbook and data files, and World Bank and OECD GDP estimates.
Categories, topics:
Economy & Growth, Private Sector, Trade
Last updated:
apr 23, 2017
Indicators value changes by year
Maximum:
14.443
jan 1, 1995
At the date of observation
Value
Absolute change
Change from previous value
jan 1, 1978
8.795
+8.795
0.0%
jan 1, 1979
9.601
+0.806
9.17%
jan 1, 1980
9.412
-0.189
-1.97%
jan 1, 1981
10.001
+0.589
6.26%
jan 1, 1982
9.565
-0.436
-4.36%
jan 1, 1983
9.133
-0.432
-4.52%
jan 1, 1984
8.754
-0.379
-4.15%
jan 1, 1985
8.398
-0.356
-4.07%
jan 1, 1986
8.658
+0.26
3.1%
jan 1, 1987
8.099
-0.559
-6.45%
jan 1, 1988
8.499
+0.399
4.93%
jan 1, 1989
9.036
+0.537
6.32%
jan 1, 1990
9.993
+0.958
10.6%
jan 1, 1991
10.387
+0.394
3.94%
jan 1, 1992
10.153
-0.234
-2.25%
jan 1, 1993
11.673
+1.52
14.97%
jan 1, 1994
13.132
+1.459
12.5%
jan 1, 1995
14.443
+1.31
9.98%
jan 1, 1996
14.292
-0.151
-1.04%
jan 1, 1997
12.685
-1.607
-11.24%
jan 1, 1998
12.581
-0.104
-0.82%
jan 1, 1999
13.026
+0.445
3.54%
jan 1, 2000
13.441
+0.414
3.18%
jan 1, 2001
12.406
-1.035
-7.7%
jan 1, 2002
12.336
-0.07
-0.56%
jan 1, 2003
12.267
-0.069
-0.56%
jan 1, 2004
11.733
-0.534
-4.35%
jan 1, 2005
13.376
+1.643
14.01%
jan 1, 2006
13.579
+0.202
1.51%
jan 1, 2007
13.451
-0.128
-0.94%
jan 1, 2008
13.895
+0.445
3.31%
jan 1, 2009
13.881
-0.014
-0.1%
jan 1, 2010
12.156
-1.725
-12.43%
jan 1, 2011
12.371
+0.215
1.77%
jan 1, 2012
13.173
+0.801
6.48%
jan 1, 2013
13.29
+0.117
0.89%
jan 1, 2014
13.19
-0.1
-0.75%
jan 1, 2015
12.38
-0.81
-6.14%
Ranking of countries by current statistics by years


Comments: