29
/
en
AIzaSyAYiBZKx7MnpbEhh9jyipgxe19OcubqV5w
April 1, 2024
63113
World
WLD
false
2
1
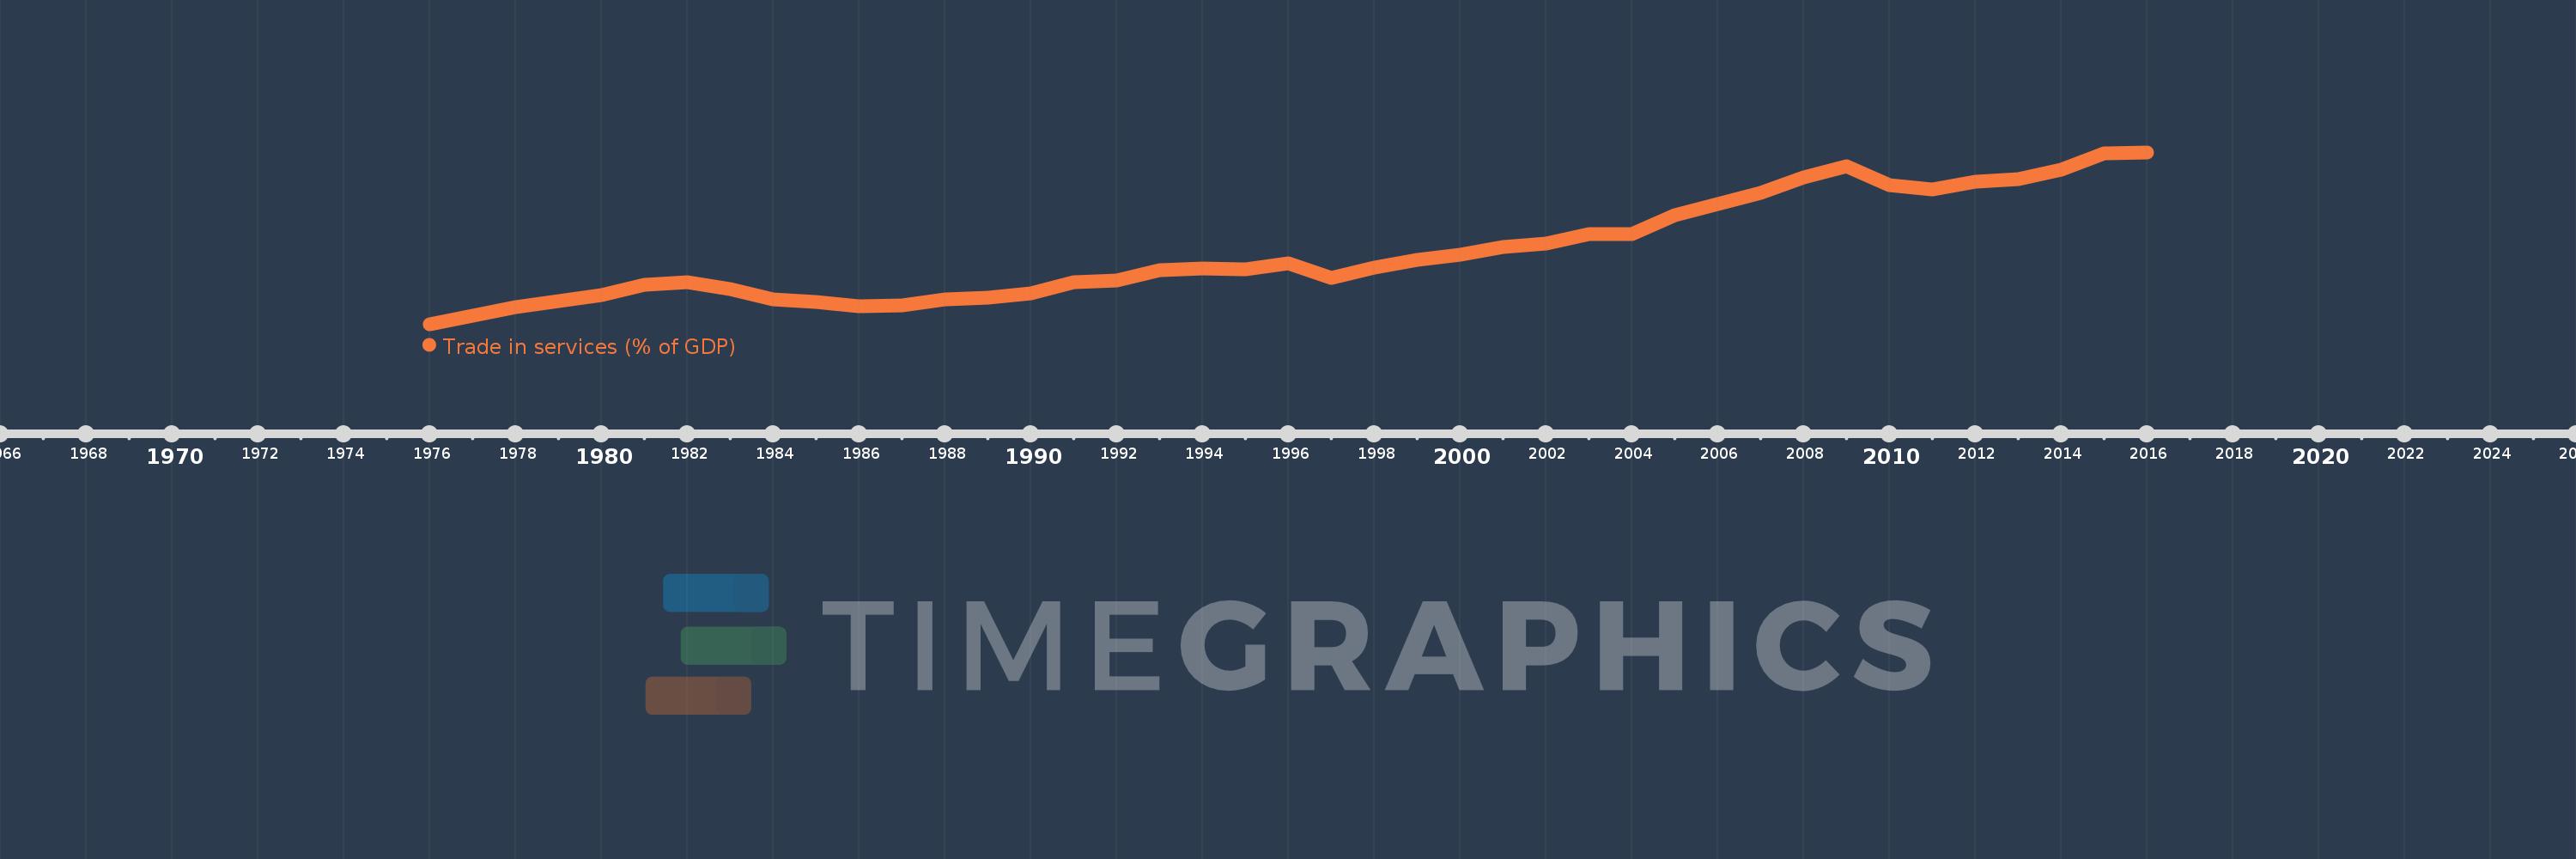
Trade in services (% of GDP)
2016,2015,2014,2013,2012,2011,2010,2009,2008,2007,2006,2005,2004,2003,2002,2001,2000,1999,1998,1997,1996,1995,1994,1993,1992,1991,1990,1989,1988,1987,1986,1985,1984,1983,1982,1981,1980,1979,1978,1977,1976
This statistics in other country:
AfghanistanAlbaniaAlgeriaAngolaAntigua and BarbudaArab WorldArgentinaArmeniaArubaAustraliaAustriaAzerbaijanBahamas, TheBahrainBangladeshBarbadosBelarusBelgiumBelizeBeninBermudaBhutanBoliviaBosnia and HerzegovinaBotswanaBrazilBrunei DarussalamBulgariaBurkina FasoBurundiCabo VerdeCambodiaCameroonCanadaCaribbean small statesCentral African RepublicCentral Europe and the BalticsChadChileChinaColombiaComorosCongo, Dem. Rep.Congo, Rep.Costa RicaCote d'IvoireCroatiaCyprusCzech RepublicDenmarkDjiboutiDominicaDominican RepublicEarly-demographic dividendEast Asia & PacificEast Asia & Pacific (excluding high income)East Asia & Pacific (IDA & IBRD countries)EcuadorEgypt, Arab Rep.El SalvadorEquatorial GuineaEritreaEstoniaEthiopiaEuro areaEurope & Central AsiaEurope & Central Asia (excluding high income)Europe & Central Asia (IDA & IBRD countries)European UnionFaroe IslandsFijiFinlandFragile and conflict affected situationsFranceGabonGambia, TheGeorgiaGermanyGhanaGreeceGrenadaGuatemalaGuineaGuinea-BissauGuyanaHaitiHeavily indebted poor countries (HIPC)High incomeHondurasHong Kong SAR, ChinaHungaryIBRD onlyIcelandIDA & IBRD totalIDA blendIDA onlyIDA totalIndiaIndonesiaIran, Islamic Rep.IraqIrelandIsraelItalyJamaicaJapanJordanKazakhstanKenyaKiribatiKorea, Rep.KosovoKuwaitKyrgyz RepublicLao PDRLate-demographic dividendLatin America & Caribbean Latin America & Caribbean (excluding high income)Latin America & the Caribbean (IDA & IBRD countries)LatviaLeast developed countries: UN classificationLebanonLesothoLiberiaLibyaLithuaniaLow & middle incomeLow incomeLower middle incomeLuxembourgMacao SAR, ChinaMacedonia, FYRMadagascarMalawiMalaysiaMaldivesMaliMaltaMarshall IslandsMauritaniaMauritiusMexicoMicronesia, Fed. Sts.Middle East & North AfricaMiddle East & North Africa (excluding high income)Middle East & North Africa (IDA & IBRD countries)Middle incomeMoldovaMongoliaMontenegroMoroccoMozambiqueMyanmarNamibiaNepalNetherlandsNew ZealandNicaraguaNigerNigeriaNorth AmericaNorwayOECD membersOmanOther small statesPacific island small statesPakistanPalauPanamaPapua New GuineaParaguayPeruPhilippinesPolandPortugalPost-demographic dividendPre-demographic dividendQatarRomaniaRussian FederationRwandaSamoaSao Tome and PrincipeSaudi ArabiaSenegalSerbiaSeychellesSierra LeoneSingaporeSlovak RepublicSloveniaSmall statesSolomon IslandsSouth AfricaSouth AsiaSouth Asia (IDA & IBRD)South SudanSpainSri LankaSt. Kitts and NevisSt. LuciaSt. Vincent and the GrenadinesSub-Saharan Africa Sub-Saharan Africa (excluding high income)Sub-Saharan Africa (IDA & IBRD countries)SudanSurinameSwazilandSwedenSwitzerlandSyrian Arab RepublicTajikistanTanzaniaThailandTimor-LesteTogoTongaTrinidad and TobagoTunisiaTurkeyTuvaluUgandaUkraineUnited KingdomUnited StatesUpper middle incomeUruguayVanuatuVenezuela, RBVietnamWest Bank and GazaWorldYemen, Rep.ZambiaZimbabwe Timeline:
This timeline shows a graph from 1976 to 2016 of World. No data until 1975. Number of actual observations by date: 41.
Source name:
World Development Indicators
Source organization:
International Monetary Fund, Balance of Payments Statistics Yearbook and data files, and World Bank and OECD GDP estimates.
Categories, topics:
Economy & Growth, Private Sector, Trade
Last updated:
apr 23, 2017
Indicators value changes by year
Maximum:
13.048
jan 1, 2016
At the date of observation
Value
Absolute change
Change from previous value
jan 1, 1976
6.203
+6.203
0.0%
jan 1, 1977
6.545
+0.342
5.51%
jan 1, 1978
6.886
+0.342
5.22%
jan 1, 1979
7.134
+0.247
3.59%
jan 1, 1980
7.373
+0.239
3.35%
jan 1, 1981
7.788
+0.415
5.64%
jan 1, 1982
7.885
+0.097
1.24%
jan 1, 1983
7.598
-0.287
-3.64%
jan 1, 1984
7.191
-0.407
-5.35%
jan 1, 1985
7.084
-0.108
-1.5%
jan 1, 1986
6.905
-0.179
-2.53%
jan 1, 1987
6.947
+0.043
0.62%
jan 1, 1988
7.198
+0.251
3.61%
jan 1, 1989
7.257
+0.059
0.82%
jan 1, 1990
7.42
+0.163
2.24%
jan 1, 1991
7.87
+0.45
6.06%
jan 1, 1992
7.961
+0.091
1.15%
jan 1, 1993
8.353
+0.393
4.93%
jan 1, 1994
8.425
+0.072
0.86%
jan 1, 1995
8.385
-0.04
-0.48%
jan 1, 1996
8.636
+0.251
3.0%
jan 1, 1997
8.041
-0.595
-6.89%
jan 1, 1998
8.442
+0.401
4.98%
jan 1, 1999
8.751
+0.309
3.66%
jan 1, 2000
8.956
+0.205
2.35%
jan 1, 2001
9.285
+0.329
3.67%
jan 1, 2002
9.402
+0.117
1.25%
jan 1, 2003
9.805
+0.404
4.29%
jan 1, 2004
9.791
-0.014
-0.15%
jan 1, 2005
10.539
+0.748
7.64%
jan 1, 2006
11.006
+0.467
4.43%
jan 1, 2007
11.433
+0.427
3.88%
jan 1, 2008
12.06
+0.628
5.49%
jan 1, 2009
12.499
+0.439
3.64%
jan 1, 2010
11.751
-0.749
-5.99%
jan 1, 2011
11.579
-0.172
-1.46%
jan 1, 2012
11.893
+0.314
2.71%
jan 1, 2013
11.97
+0.077
0.65%
jan 1, 2014
12.377
+0.407
3.4%
jan 1, 2015
13.015
+0.638
5.16%
jan 1, 2016
13.048
+0.032
0.25%
Ranking of countries by current statistics by years


Comments: