29
/
en
AIzaSyAYiBZKx7MnpbEhh9jyipgxe19OcubqV5w
April 1, 2024
62283
Upper middle income
UMC
false
2
1
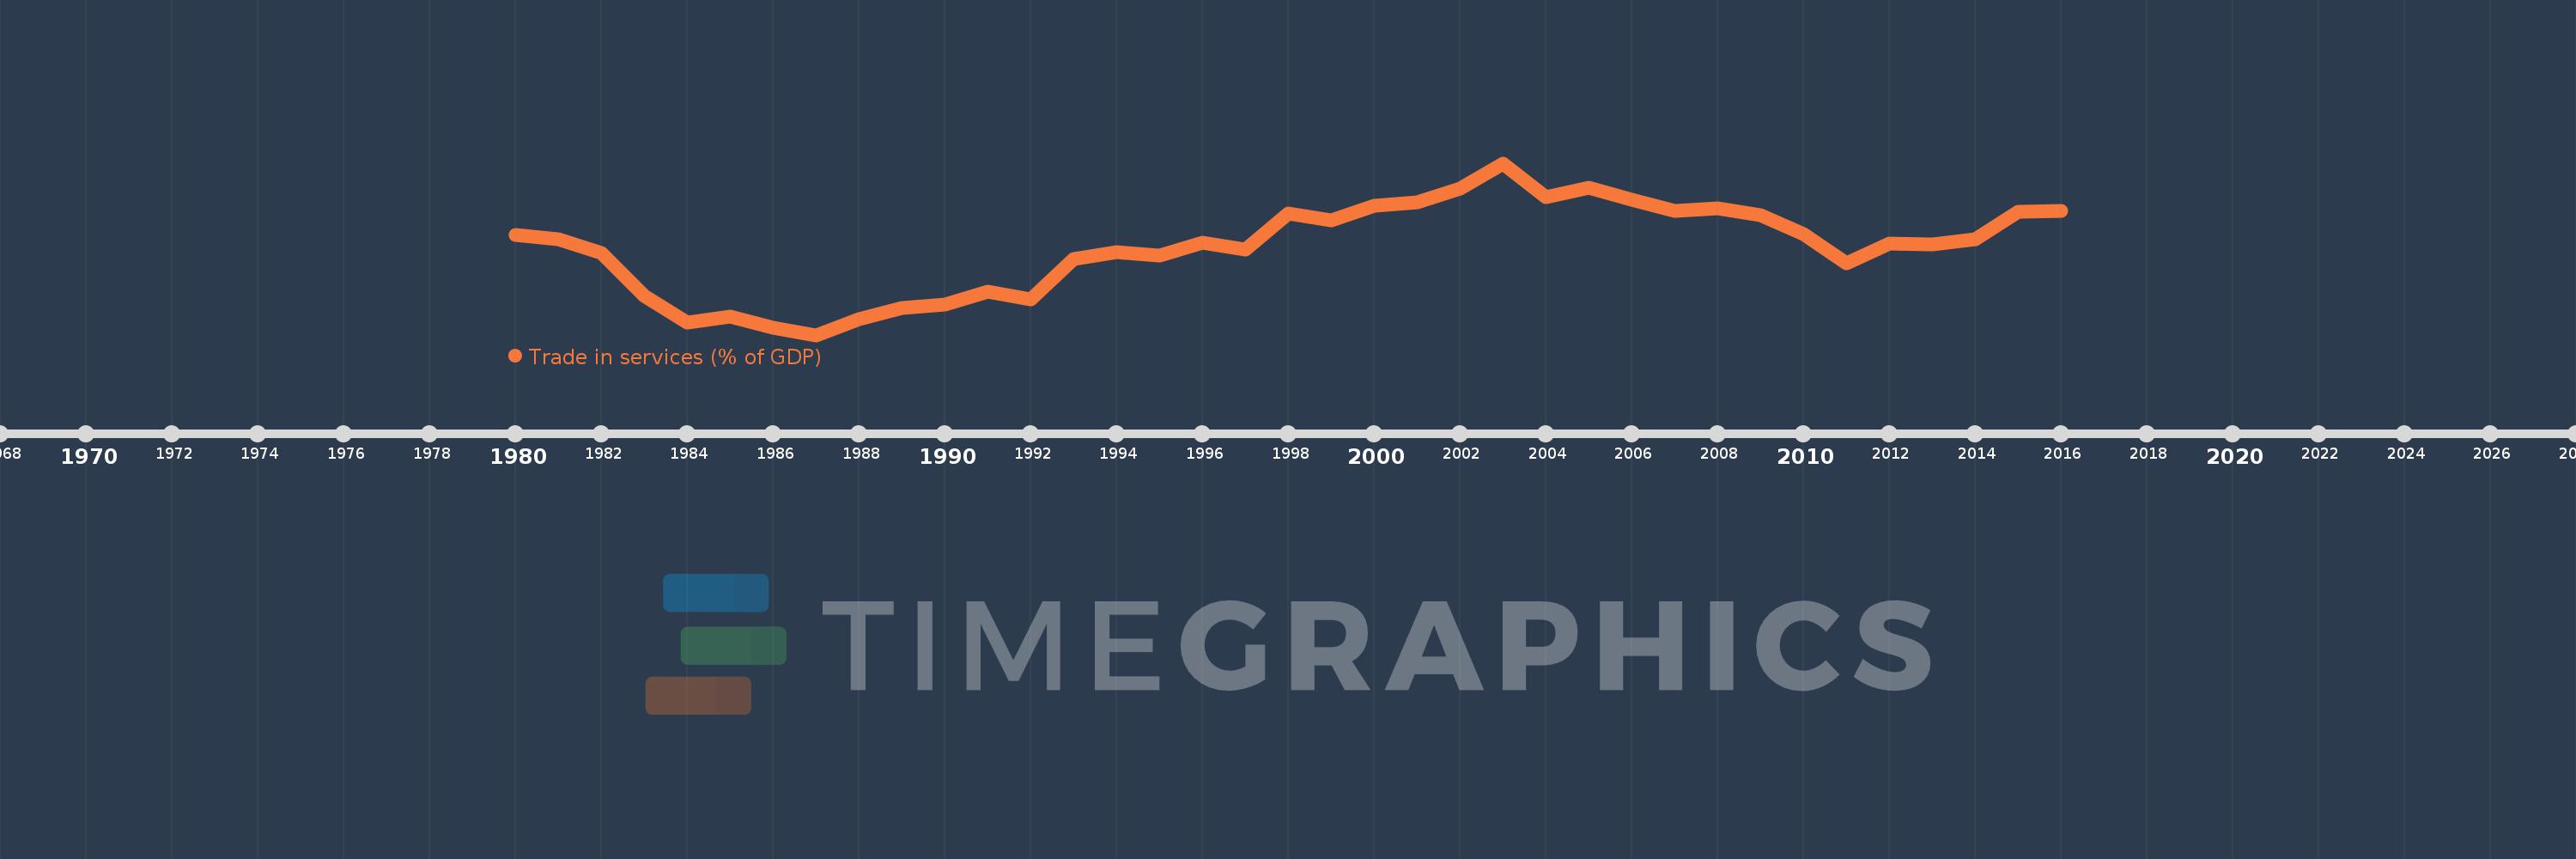
Trade in services (% of GDP)
2016,2015,2014,2013,2012,2011,2010,2009,2008,2007,2006,2005,2004,2003,2002,2001,2000,1999,1998,1997,1996,1995,1994,1993,1992,1991,1990,1989,1988,1987,1986,1985,1984,1983,1982,1981,1980
This statistics in other country:
AfghanistanAlbaniaAlgeriaAngolaAntigua and BarbudaArab WorldArgentinaArmeniaArubaAustraliaAustriaAzerbaijanBahamas, TheBahrainBangladeshBarbadosBelarusBelgiumBelizeBeninBermudaBhutanBoliviaBosnia and HerzegovinaBotswanaBrazilBrunei DarussalamBulgariaBurkina FasoBurundiCabo VerdeCambodiaCameroonCanadaCaribbean small statesCentral African RepublicCentral Europe and the BalticsChadChileChinaColombiaComorosCongo, Dem. Rep.Congo, Rep.Costa RicaCote d'IvoireCroatiaCyprusCzech RepublicDenmarkDjiboutiDominicaDominican RepublicEarly-demographic dividendEast Asia & PacificEast Asia & Pacific (excluding high income)East Asia & Pacific (IDA & IBRD countries)EcuadorEgypt, Arab Rep.El SalvadorEquatorial GuineaEritreaEstoniaEthiopiaEuro areaEurope & Central AsiaEurope & Central Asia (excluding high income)Europe & Central Asia (IDA & IBRD countries)European UnionFaroe IslandsFijiFinlandFragile and conflict affected situationsFranceGabonGambia, TheGeorgiaGermanyGhanaGreeceGrenadaGuatemalaGuineaGuinea-BissauGuyanaHaitiHeavily indebted poor countries (HIPC)High incomeHondurasHong Kong SAR, ChinaHungaryIBRD onlyIcelandIDA & IBRD totalIDA blendIDA onlyIDA totalIndiaIndonesiaIran, Islamic Rep.IraqIrelandIsraelItalyJamaicaJapanJordanKazakhstanKenyaKiribatiKorea, Rep.KosovoKuwaitKyrgyz RepublicLao PDRLate-demographic dividendLatin America & Caribbean Latin America & Caribbean (excluding high income)Latin America & the Caribbean (IDA & IBRD countries)LatviaLeast developed countries: UN classificationLebanonLesothoLiberiaLibyaLithuaniaLow & middle incomeLow incomeLower middle incomeLuxembourgMacao SAR, ChinaMacedonia, FYRMadagascarMalawiMalaysiaMaldivesMaliMaltaMarshall IslandsMauritaniaMauritiusMexicoMicronesia, Fed. Sts.Middle East & North AfricaMiddle East & North Africa (excluding high income)Middle East & North Africa (IDA & IBRD countries)Middle incomeMoldovaMongoliaMontenegroMoroccoMozambiqueMyanmarNamibiaNepalNetherlandsNew ZealandNicaraguaNigerNigeriaNorth AmericaNorwayOECD membersOmanOther small statesPacific island small statesPakistanPalauPanamaPapua New GuineaParaguayPeruPhilippinesPolandPortugalPost-demographic dividendPre-demographic dividendQatarRomaniaRussian FederationRwandaSamoaSao Tome and PrincipeSaudi ArabiaSenegalSerbiaSeychellesSierra LeoneSingaporeSlovak RepublicSloveniaSmall statesSolomon IslandsSouth AfricaSouth AsiaSouth Asia (IDA & IBRD)South SudanSpainSri LankaSt. Kitts and NevisSt. LuciaSt. Vincent and the GrenadinesSub-Saharan Africa Sub-Saharan Africa (excluding high income)Sub-Saharan Africa (IDA & IBRD countries)SudanSurinameSwazilandSwedenSwitzerlandSyrian Arab RepublicTajikistanTanzaniaThailandTimor-LesteTogoTongaTrinidad and TobagoTunisiaTurkeyTuvaluUgandaUkraineUnited KingdomUnited StatesUpper middle incomeUruguayVanuatuVenezuela, RBVietnamWest Bank and GazaWorldYemen, Rep.ZambiaZimbabwe Timeline:
This timeline shows a graph from 1980 to 2016 of Upper middle income. No data until 1979. Number of actual observations by date: 37.
Source name:
World Development Indicators
Source organization:
International Monetary Fund, Balance of Payments Statistics Yearbook and data files, and World Bank and OECD GDP estimates.
Categories, topics:
Economy & Growth, Private Sector, Trade
Last updated:
apr 23, 2017
Indicators value changes by year
At the date of observation
Value
Absolute change
Change from previous value
jan 1, 1980
7.724
+7.724
0.0%
jan 1, 1981
7.598
-0.126
-1.63%
jan 1, 1982
7.179
-0.419
-5.52%
jan 1, 1983
5.94
-1.239
-17.25%
jan 1, 1984
5.167
-0.773
-13.02%
jan 1, 1985
5.338
+0.171
3.31%
jan 1, 1986
5.004
-0.334
-6.25%
jan 1, 1987
4.803
-0.202
-4.03%
jan 1, 1988
5.265
+0.462
9.63%
jan 1, 1989
5.601
+0.335
6.37%
jan 1, 1990
5.702
+0.101
1.81%
jan 1, 1991
6.074
+0.372
6.52%
jan 1, 1992
5.84
-0.234
-3.85%
jan 1, 1993
7.019
+1.179
20.2%
jan 1, 1994
7.201
+0.182
2.59%
jan 1, 1995
7.103
-0.098
-1.36%
jan 1, 1996
7.499
+0.395
5.56%
jan 1, 1997
7.292
-0.207
-2.76%
jan 1, 1998
8.341
+1.049
14.39%
jan 1, 1999
8.147
-0.194
-2.33%
jan 1, 2000
8.55
+0.403
4.95%
jan 1, 2001
8.662
+0.112
1.31%
jan 1, 2002
9.057
+0.395
4.56%
jan 1, 2003
9.798
+0.74
8.17%
jan 1, 2004
8.817
-0.981
-10.01%
jan 1, 2005
9.097
+0.28
3.18%
jan 1, 2006
8.736
-0.361
-3.97%
jan 1, 2007
8.419
-0.318
-3.64%
jan 1, 2008
8.475
+0.056
0.67%
jan 1, 2009
8.277
-0.197
-2.33%
jan 1, 2010
7.746
-0.532
-6.43%
jan 1, 2011
6.876
-0.869
-11.22%
jan 1, 2012
7.452
+0.576
8.37%
jan 1, 2013
7.437
-0.014
-0.19%
jan 1, 2014
7.588
+0.15
2.02%
jan 1, 2015
8.376
+0.789
10.39%
jan 1, 2016
8.421
+0.045
0.54%
Ranking of countries by current statistics by years


Comments: