29
/
en
AIzaSyAYiBZKx7MnpbEhh9jyipgxe19OcubqV5w
April 1, 2024
215894
Oman
OMN
true
2
1
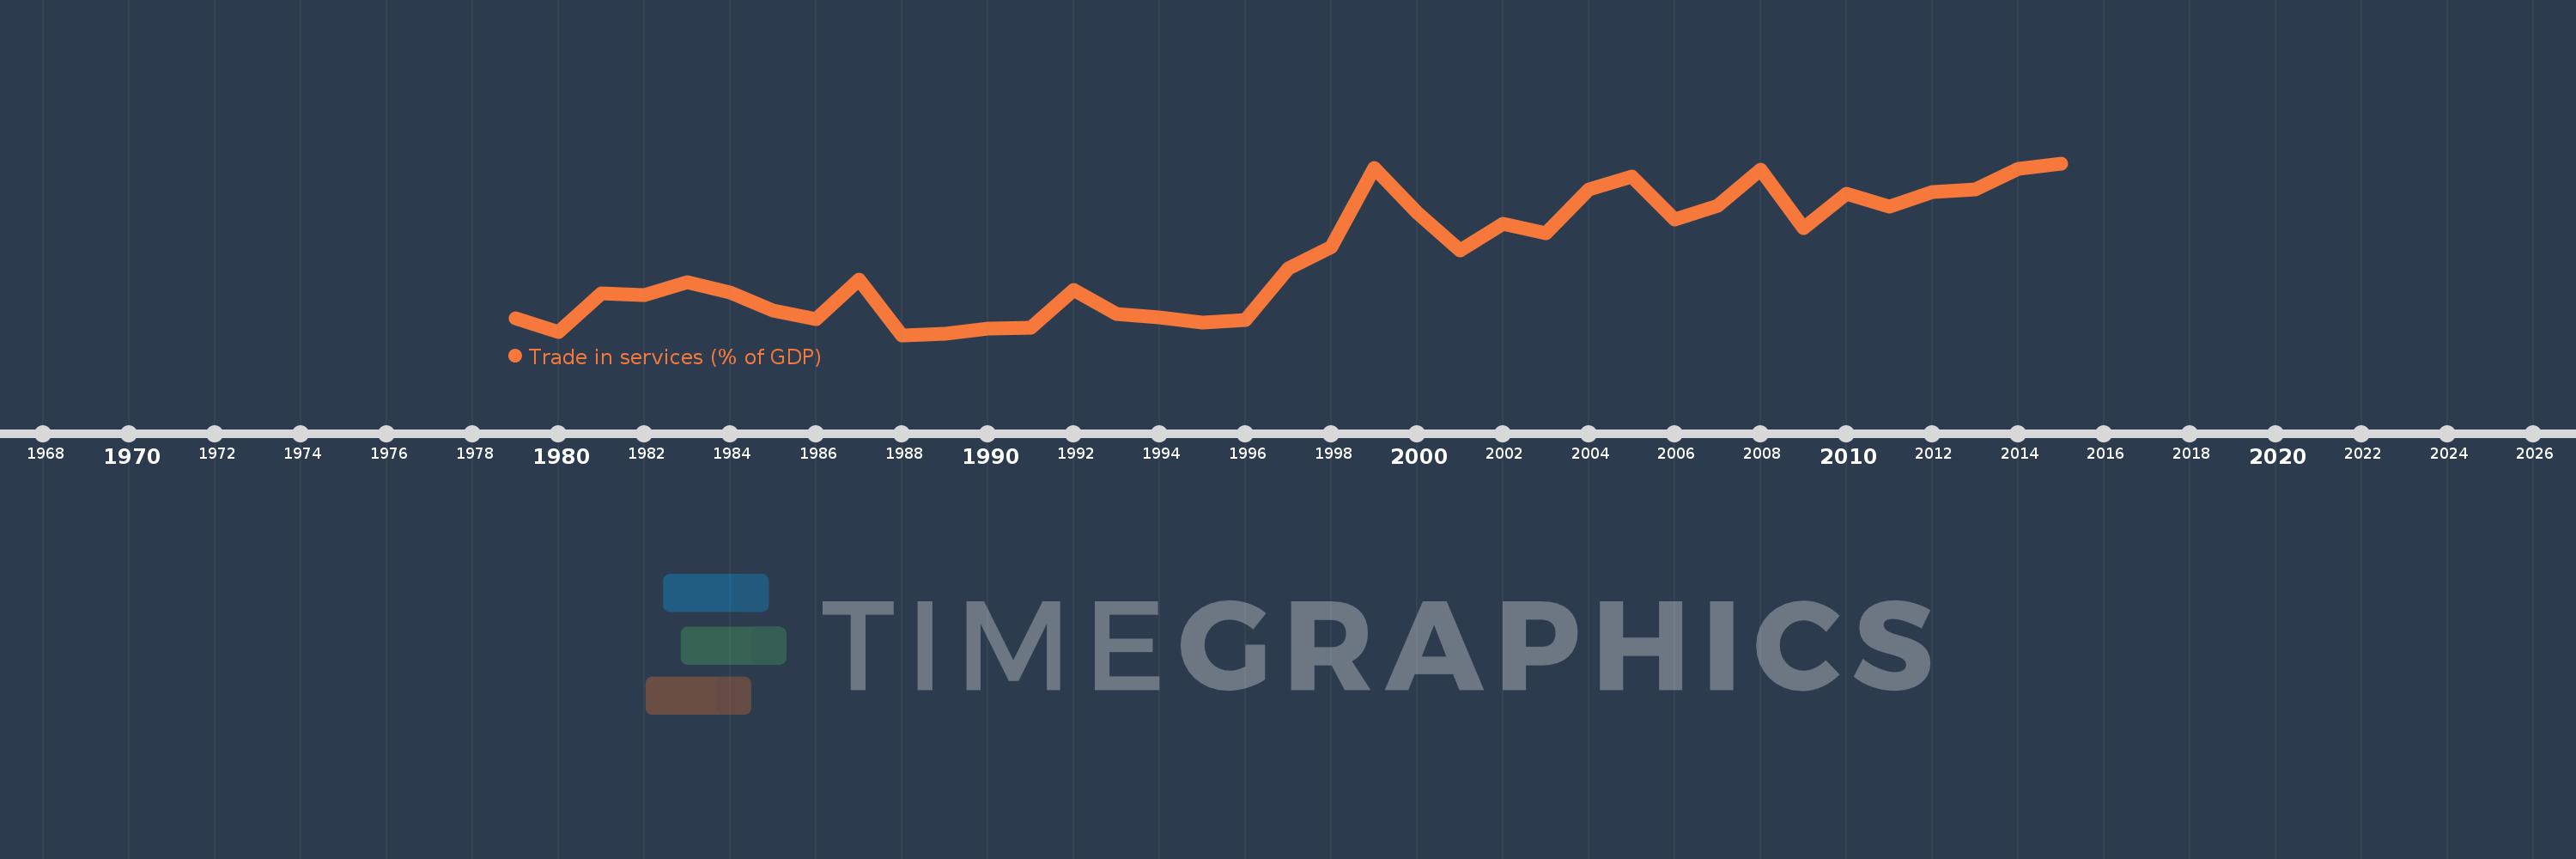
Trade in services (% of GDP)
2015,2014,2013,2012,2011,2010,2009,2008,2007,2006,2005,2004,2003,2002,2001,2000,1999,1998,1997,1996,1995,1994,1993,1992,1991,1990,1989,1988,1987,1986,1985,1984,1983,1982,1981,1980,1979
This statistics in other country:
AfghanistanAlbaniaAlgeriaAngolaAntigua and BarbudaArab WorldArgentinaArmeniaArubaAustraliaAustriaAzerbaijanBahamas, TheBahrainBangladeshBarbadosBelarusBelgiumBelizeBeninBermudaBhutanBoliviaBosnia and HerzegovinaBotswanaBrazilBrunei DarussalamBulgariaBurkina FasoBurundiCabo VerdeCambodiaCameroonCanadaCaribbean small statesCentral African RepublicCentral Europe and the BalticsChadChileChinaColombiaComorosCongo, Dem. Rep.Congo, Rep.Costa RicaCote d'IvoireCroatiaCyprusCzech RepublicDenmarkDjiboutiDominicaDominican RepublicEarly-demographic dividendEast Asia & PacificEast Asia & Pacific (excluding high income)East Asia & Pacific (IDA & IBRD countries)EcuadorEgypt, Arab Rep.El SalvadorEquatorial GuineaEritreaEstoniaEthiopiaEuro areaEurope & Central AsiaEurope & Central Asia (excluding high income)Europe & Central Asia (IDA & IBRD countries)European UnionFaroe IslandsFijiFinlandFragile and conflict affected situationsFranceGabonGambia, TheGeorgiaGermanyGhanaGreeceGrenadaGuatemalaGuineaGuinea-BissauGuyanaHaitiHeavily indebted poor countries (HIPC)High incomeHondurasHong Kong SAR, ChinaHungaryIBRD onlyIcelandIDA & IBRD totalIDA blendIDA onlyIDA totalIndiaIndonesiaIran, Islamic Rep.IraqIrelandIsraelItalyJamaicaJapanJordanKazakhstanKenyaKiribatiKorea, Rep.KosovoKuwaitKyrgyz RepublicLao PDRLate-demographic dividendLatin America & Caribbean Latin America & Caribbean (excluding high income)Latin America & the Caribbean (IDA & IBRD countries)LatviaLeast developed countries: UN classificationLebanonLesothoLiberiaLibyaLithuaniaLow & middle incomeLow incomeLower middle incomeLuxembourgMacao SAR, ChinaMacedonia, FYRMadagascarMalawiMalaysiaMaldivesMaliMaltaMarshall IslandsMauritaniaMauritiusMexicoMicronesia, Fed. Sts.Middle East & North AfricaMiddle East & North Africa (excluding high income)Middle East & North Africa (IDA & IBRD countries)Middle incomeMoldovaMongoliaMontenegroMoroccoMozambiqueMyanmarNamibiaNepalNetherlandsNew ZealandNicaraguaNigerNigeriaNorth AmericaNorwayOECD membersOmanOther small statesPacific island small statesPakistanPalauPanamaPapua New GuineaParaguayPeruPhilippinesPolandPortugalPost-demographic dividendPre-demographic dividendQatarRomaniaRussian FederationRwandaSamoaSao Tome and PrincipeSaudi ArabiaSenegalSerbiaSeychellesSierra LeoneSingaporeSlovak RepublicSloveniaSmall statesSolomon IslandsSouth AfricaSouth AsiaSouth Asia (IDA & IBRD)South SudanSpainSri LankaSt. Kitts and NevisSt. LuciaSt. Vincent and the GrenadinesSub-Saharan Africa Sub-Saharan Africa (excluding high income)Sub-Saharan Africa (IDA & IBRD countries)SudanSurinameSwazilandSwedenSwitzerlandSyrian Arab RepublicTajikistanTanzaniaThailandTimor-LesteTogoTongaTrinidad and TobagoTunisiaTurkeyTuvaluUgandaUkraineUnited KingdomUnited StatesUpper middle incomeUruguayVanuatuVenezuela, RBVietnamWest Bank and GazaWorldYemen, Rep.ZambiaZimbabwe Timeline:
This timeline shows a graph from 1979 to 2015 of Oman. No data until 1978. Number of actual observations by date: 37.
Source name:
World Development Indicators
Source organization:
International Monetary Fund, Balance of Payments Statistics Yearbook and data files, and World Bank and OECD GDP estimates.
Categories, topics:
Economy & Growth, Private Sector, Trade
Last updated:
apr 23, 2017
Indicators value changes by year
Maximum:
16.483
jan 1, 2015
At the date of observation
Value
Absolute change
Change from previous value
jan 1, 1979
7.332
+7.332
0.0%
jan 1, 1980
6.491
-0.841
-11.48%
jan 1, 1981
8.799
+2.308
35.56%
jan 1, 1982
8.667
-0.132
-1.51%
jan 1, 1983
9.431
+0.765
8.82%
jan 1, 1984
8.854
-0.577
-6.12%
jan 1, 1985
7.788
-1.066
-12.04%
jan 1, 1986
7.269
-0.519
-6.67%
jan 1, 1987
9.58
+2.311
31.79%
jan 1, 1988
6.326
-3.254
-33.96%
jan 1, 1989
6.389
+0.062
0.99%
jan 1, 1990
6.713
+0.324
5.07%
jan 1, 1991
6.733
+0.02
0.3%
jan 1, 1992
9.014
+2.282
33.89%
jan 1, 1993
7.592
-1.422
-15.78%
jan 1, 1994
7.359
-0.233
-3.07%
jan 1, 1995
7.068
-0.291
-3.95%
jan 1, 1996
7.232
+0.164
2.31%
jan 1, 1997
10.246
+3.014
41.67%
jan 1, 1998
11.52
+1.274
12.43%
jan 1, 1999
16.181
+4.662
40.47%
jan 1, 2000
13.538
-2.644
-16.34%
jan 1, 2001
11.331
-2.207
-16.3%
jan 1, 2002
12.878
+1.548
13.66%
jan 1, 2003
12.342
-0.536
-4.16%
jan 1, 2004
14.924
+2.582
20.92%
jan 1, 2005
15.702
+0.778
5.21%
jan 1, 2006
13.141
-2.561
-16.31%
jan 1, 2007
13.992
+0.851
6.48%
jan 1, 2008
16.105
+2.113
15.1%
jan 1, 2009
12.648
-3.456
-21.46%
jan 1, 2010
14.681
+2.032
16.07%
jan 1, 2011
13.935
-0.746
-5.08%
jan 1, 2012
14.788
+0.853
6.12%
jan 1, 2013
14.936
+0.148
1.0%
jan 1, 2014
16.168
+1.232
8.25%
jan 1, 2015
16.483
+0.314
1.94%
Ranking of countries by current statistics by years


Comments: