29
/
en
AIzaSyAYiBZKx7MnpbEhh9jyipgxe19OcubqV5w
April 1, 2024
133724
Finland
FIN
true
2
1
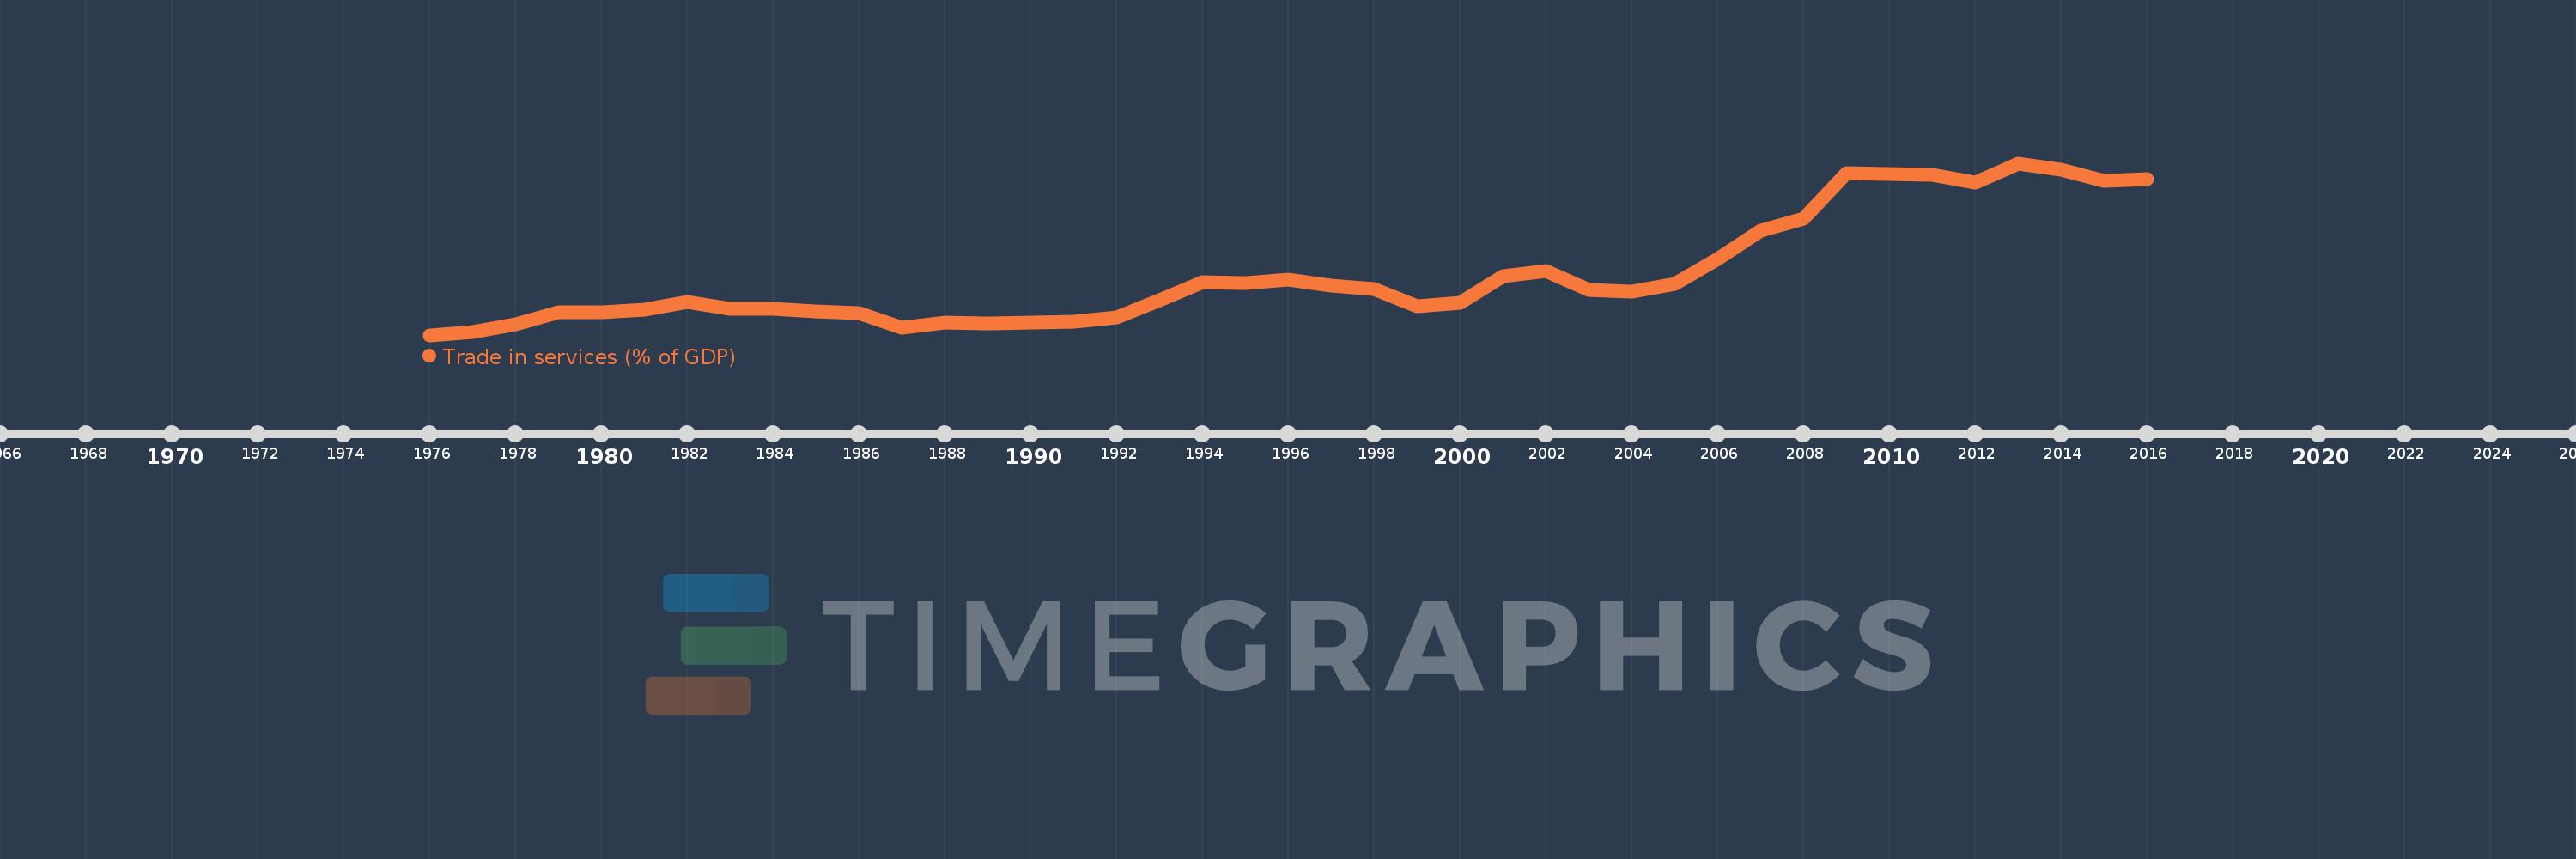
Trade in services (% of GDP)
2016,2015,2014,2013,2012,2011,2010,2009,2008,2007,2006,2005,2004,2003,2002,2001,2000,1999,1998,1997,1996,1995,1994,1993,1992,1991,1990,1989,1988,1987,1986,1985,1984,1983,1982,1981,1980,1979,1978,1977,1976
This statistics in other country:
AfghanistanAlbaniaAlgeriaAngolaAntigua and BarbudaArab WorldArgentinaArmeniaArubaAustraliaAustriaAzerbaijanBahamas, TheBahrainBangladeshBarbadosBelarusBelgiumBelizeBeninBermudaBhutanBoliviaBosnia and HerzegovinaBotswanaBrazilBrunei DarussalamBulgariaBurkina FasoBurundiCabo VerdeCambodiaCameroonCanadaCaribbean small statesCentral African RepublicCentral Europe and the BalticsChadChileChinaColombiaComorosCongo, Dem. Rep.Congo, Rep.Costa RicaCote d'IvoireCroatiaCyprusCzech RepublicDenmarkDjiboutiDominicaDominican RepublicEarly-demographic dividendEast Asia & PacificEast Asia & Pacific (excluding high income)East Asia & Pacific (IDA & IBRD countries)EcuadorEgypt, Arab Rep.El SalvadorEquatorial GuineaEritreaEstoniaEthiopiaEuro areaEurope & Central AsiaEurope & Central Asia (excluding high income)Europe & Central Asia (IDA & IBRD countries)European UnionFaroe IslandsFijiFinlandFragile and conflict affected situationsFranceGabonGambia, TheGeorgiaGermanyGhanaGreeceGrenadaGuatemalaGuineaGuinea-BissauGuyanaHaitiHeavily indebted poor countries (HIPC)High incomeHondurasHong Kong SAR, ChinaHungaryIBRD onlyIcelandIDA & IBRD totalIDA blendIDA onlyIDA totalIndiaIndonesiaIran, Islamic Rep.IraqIrelandIsraelItalyJamaicaJapanJordanKazakhstanKenyaKiribatiKorea, Rep.KosovoKuwaitKyrgyz RepublicLao PDRLate-demographic dividendLatin America & Caribbean Latin America & Caribbean (excluding high income)Latin America & the Caribbean (IDA & IBRD countries)LatviaLeast developed countries: UN classificationLebanonLesothoLiberiaLibyaLithuaniaLow & middle incomeLow incomeLower middle incomeLuxembourgMacao SAR, ChinaMacedonia, FYRMadagascarMalawiMalaysiaMaldivesMaliMaltaMarshall IslandsMauritaniaMauritiusMexicoMicronesia, Fed. Sts.Middle East & North AfricaMiddle East & North Africa (excluding high income)Middle East & North Africa (IDA & IBRD countries)Middle incomeMoldovaMongoliaMontenegroMoroccoMozambiqueMyanmarNamibiaNepalNetherlandsNew ZealandNicaraguaNigerNigeriaNorth AmericaNorwayOECD membersOmanOther small statesPacific island small statesPakistanPalauPanamaPapua New GuineaParaguayPeruPhilippinesPolandPortugalPost-demographic dividendPre-demographic dividendQatarRomaniaRussian FederationRwandaSamoaSao Tome and PrincipeSaudi ArabiaSenegalSerbiaSeychellesSierra LeoneSingaporeSlovak RepublicSloveniaSmall statesSolomon IslandsSouth AfricaSouth AsiaSouth Asia (IDA & IBRD)South SudanSpainSri LankaSt. Kitts and NevisSt. LuciaSt. Vincent and the GrenadinesSub-Saharan Africa Sub-Saharan Africa (excluding high income)Sub-Saharan Africa (IDA & IBRD countries)SudanSurinameSwazilandSwedenSwitzerlandSyrian Arab RepublicTajikistanTanzaniaThailandTimor-LesteTogoTongaTrinidad and TobagoTunisiaTurkeyTuvaluUgandaUkraineUnited KingdomUnited StatesUpper middle incomeUruguayVanuatuVenezuela, RBVietnamWest Bank and GazaWorldYemen, Rep.ZambiaZimbabwe Timeline:
This timeline shows a graph from 1976 to 2016 of Finland. No data until 1975. Number of actual observations by date: 41.
Source name:
World Development Indicators
Source organization:
International Monetary Fund, Balance of Payments Statistics Yearbook and data files, and World Bank and OECD GDP estimates.
Categories, topics:
Economy & Growth, Private Sector, Trade
Last updated:
apr 23, 2017
Indicators value changes by year
Maximum:
23.322
jan 1, 2013
At the date of observation
Value
Absolute change
Change from previous value
jan 1, 1976
7.53
+7.53
0.0%
jan 1, 1977
7.778
+0.249
3.3%
jan 1, 1978
8.49
+0.711
9.14%
jan 1, 1979
9.628
+1.139
13.41%
jan 1, 1980
9.617
-0.011
-0.11%
jan 1, 1981
9.896
+0.279
2.9%
jan 1, 1982
10.558
+0.661
6.68%
jan 1, 1983
9.956
-0.602
-5.7%
jan 1, 1984
9.923
-0.032
-0.32%
jan 1, 1985
9.677
-0.246
-2.48%
jan 1, 1986
9.581
-0.096
-0.99%
jan 1, 1987
8.193
-1.388
-14.49%
jan 1, 1988
8.713
+0.52
6.35%
jan 1, 1989
8.63
-0.082
-0.95%
jan 1, 1990
8.665
+0.035
0.4%
jan 1, 1991
8.743
+0.078
0.91%
jan 1, 1992
9.165
+0.422
4.83%
jan 1, 1993
10.734
+1.569
17.12%
jan 1, 1994
12.349
+1.615
15.04%
jan 1, 1995
12.33
-0.019
-0.15%
jan 1, 1996
12.632
+0.302
2.45%
jan 1, 1997
12.097
-0.535
-4.24%
jan 1, 1998
11.77
-0.326
-2.7%
jan 1, 1999
10.214
-1.557
-13.23%
jan 1, 2000
10.485
+0.272
2.66%
jan 1, 2001
12.908
+2.423
23.1%
jan 1, 2002
13.42
+0.512
3.97%
jan 1, 2003
11.656
-1.764
-13.15%
jan 1, 2004
11.512
-0.144
-1.24%
jan 1, 2005
12.205
+0.694
6.03%
jan 1, 2006
14.483
+2.278
18.66%
jan 1, 2007
17.103
+2.62
18.09%
jan 1, 2008
18.257
+1.154
6.75%
jan 1, 2009
22.452
+4.194
22.97%
jan 1, 2010
22.346
-0.105
-0.47%
jan 1, 2011
22.257
-0.089
-0.4%
jan 1, 2012
21.574
-0.683
-3.07%
jan 1, 2013
23.322
+1.748
8.1%
jan 1, 2014
22.697
-0.624
-2.68%
jan 1, 2015
21.701
-0.996
-4.39%
jan 1, 2016
21.868
+0.166
0.77%
Ranking of countries by current statistics by years


Comments: