29
/
en
AIzaSyAYiBZKx7MnpbEhh9jyipgxe19OcubqV5w
April 1, 2024
121614
Dominica
DMA
true
2
1
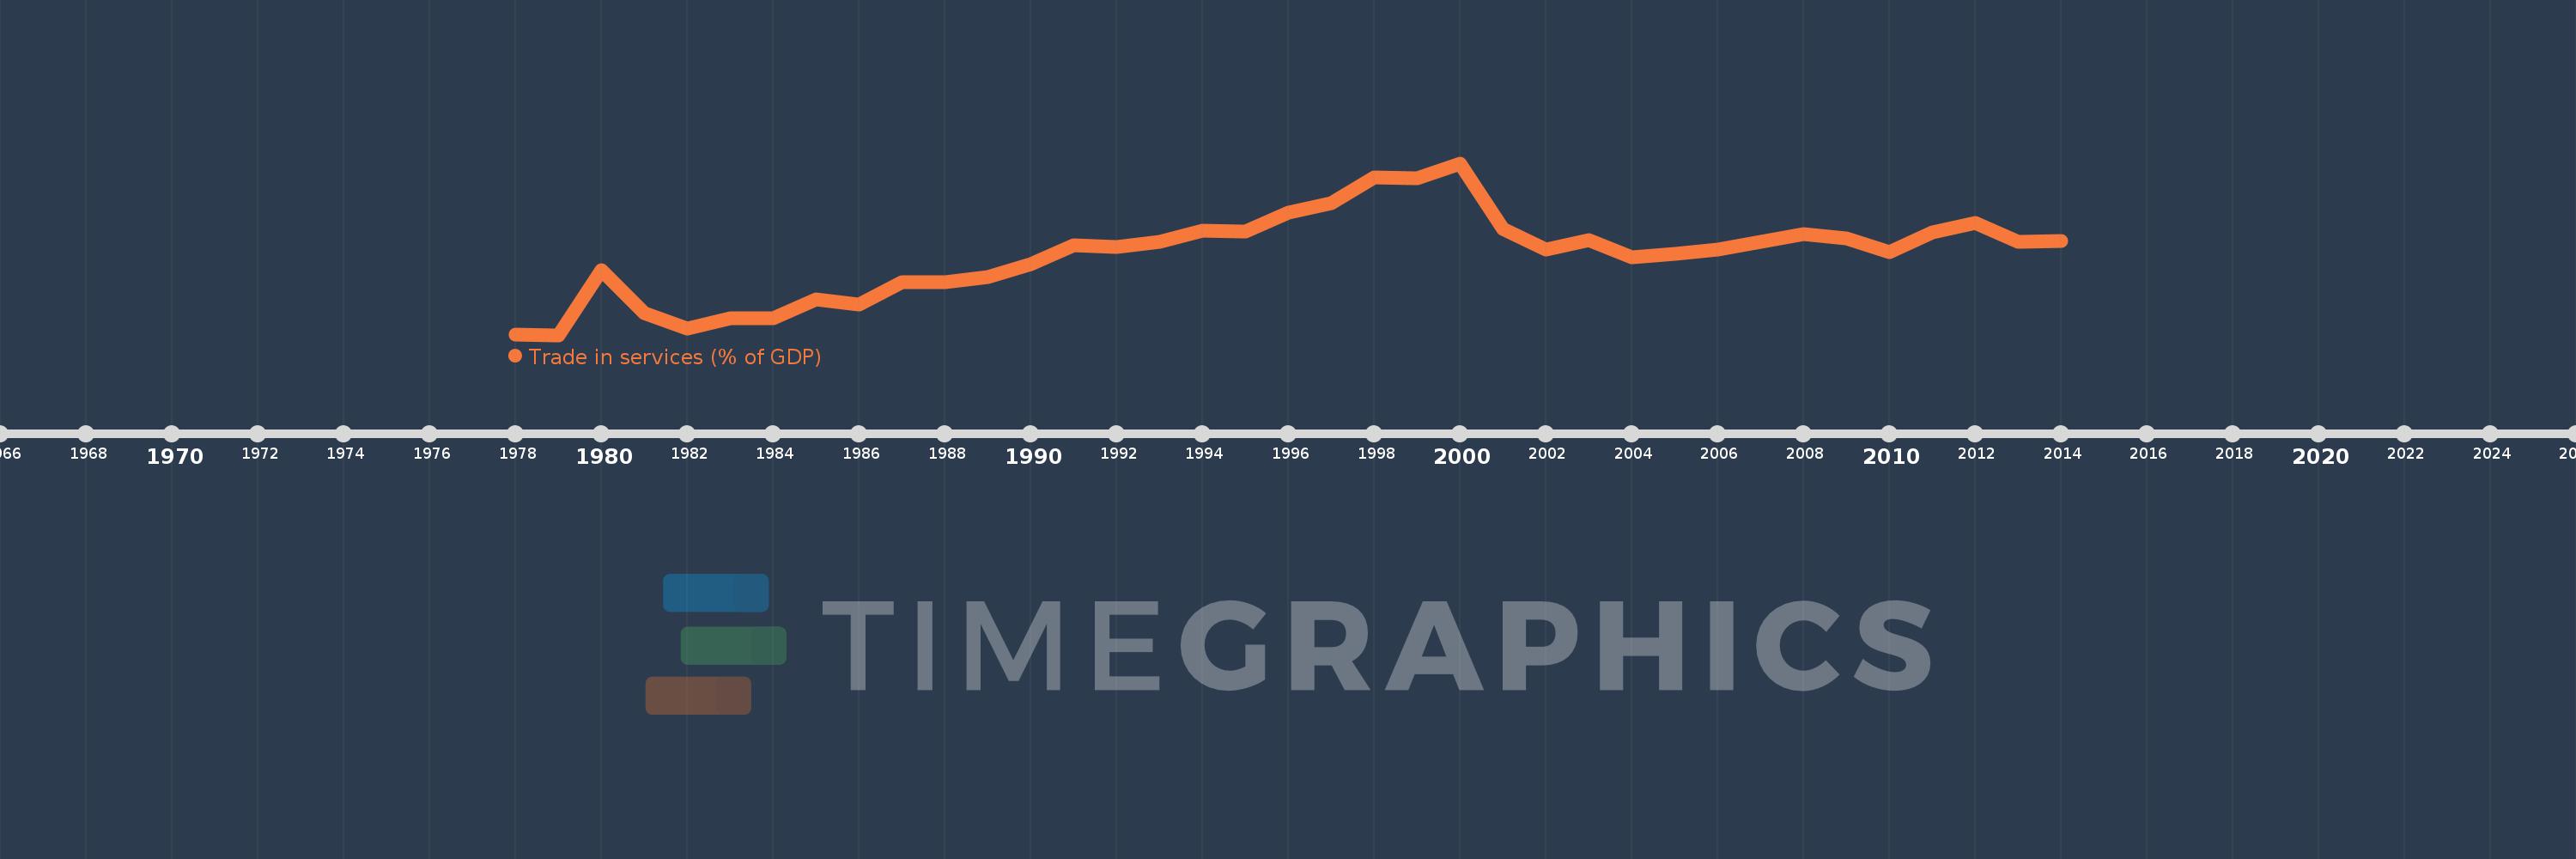
Trade in services (% of GDP)
2014,2013,2012,2011,2010,2009,2008,2007,2006,2005,2004,2003,2002,2001,2000,1999,1998,1997,1996,1995,1994,1993,1992,1991,1990,1989,1988,1987,1986,1985,1984,1983,1982,1981,1980,1979,1978
This statistics in other country:
AfghanistanAlbaniaAlgeriaAngolaAntigua and BarbudaArab WorldArgentinaArmeniaArubaAustraliaAustriaAzerbaijanBahamas, TheBahrainBangladeshBarbadosBelarusBelgiumBelizeBeninBermudaBhutanBoliviaBosnia and HerzegovinaBotswanaBrazilBrunei DarussalamBulgariaBurkina FasoBurundiCabo VerdeCambodiaCameroonCanadaCaribbean small statesCentral African RepublicCentral Europe and the BalticsChadChileChinaColombiaComorosCongo, Dem. Rep.Congo, Rep.Costa RicaCote d'IvoireCroatiaCyprusCzech RepublicDenmarkDjiboutiDominicaDominican RepublicEarly-demographic dividendEast Asia & PacificEast Asia & Pacific (excluding high income)East Asia & Pacific (IDA & IBRD countries)EcuadorEgypt, Arab Rep.El SalvadorEquatorial GuineaEritreaEstoniaEthiopiaEuro areaEurope & Central AsiaEurope & Central Asia (excluding high income)Europe & Central Asia (IDA & IBRD countries)European UnionFaroe IslandsFijiFinlandFragile and conflict affected situationsFranceGabonGambia, TheGeorgiaGermanyGhanaGreeceGrenadaGuatemalaGuineaGuinea-BissauGuyanaHaitiHeavily indebted poor countries (HIPC)High incomeHondurasHong Kong SAR, ChinaHungaryIBRD onlyIcelandIDA & IBRD totalIDA blendIDA onlyIDA totalIndiaIndonesiaIran, Islamic Rep.IraqIrelandIsraelItalyJamaicaJapanJordanKazakhstanKenyaKiribatiKorea, Rep.KosovoKuwaitKyrgyz RepublicLao PDRLate-demographic dividendLatin America & Caribbean Latin America & Caribbean (excluding high income)Latin America & the Caribbean (IDA & IBRD countries)LatviaLeast developed countries: UN classificationLebanonLesothoLiberiaLibyaLithuaniaLow & middle incomeLow incomeLower middle incomeLuxembourgMacao SAR, ChinaMacedonia, FYRMadagascarMalawiMalaysiaMaldivesMaliMaltaMarshall IslandsMauritaniaMauritiusMexicoMicronesia, Fed. Sts.Middle East & North AfricaMiddle East & North Africa (excluding high income)Middle East & North Africa (IDA & IBRD countries)Middle incomeMoldovaMongoliaMontenegroMoroccoMozambiqueMyanmarNamibiaNepalNetherlandsNew ZealandNicaraguaNigerNigeriaNorth AmericaNorwayOECD membersOmanOther small statesPacific island small statesPakistanPalauPanamaPapua New GuineaParaguayPeruPhilippinesPolandPortugalPost-demographic dividendPre-demographic dividendQatarRomaniaRussian FederationRwandaSamoaSao Tome and PrincipeSaudi ArabiaSenegalSerbiaSeychellesSierra LeoneSingaporeSlovak RepublicSloveniaSmall statesSolomon IslandsSouth AfricaSouth AsiaSouth Asia (IDA & IBRD)South SudanSpainSri LankaSt. Kitts and NevisSt. LuciaSt. Vincent and the GrenadinesSub-Saharan Africa Sub-Saharan Africa (excluding high income)Sub-Saharan Africa (IDA & IBRD countries)SudanSurinameSwazilandSwedenSwitzerlandSyrian Arab RepublicTajikistanTanzaniaThailandTimor-LesteTogoTongaTrinidad and TobagoTunisiaTurkeyTuvaluUgandaUkraineUnited KingdomUnited StatesUpper middle incomeUruguayVanuatuVenezuela, RBVietnamWest Bank and GazaWorldYemen, Rep.ZambiaZimbabwe Timeline:
This timeline shows a graph from 1978 to 2014 of Dominica. No data until 1977. Number of actual observations by date: 37.
Source name:
World Development Indicators
Source organization:
International Monetary Fund, Balance of Payments Statistics Yearbook and data files, and World Bank and OECD GDP estimates.
Categories, topics:
Economy & Growth, Private Sector, Trade
Last updated:
apr 23, 2017
Indicators value changes by year
Minimum:
14.374
jan 1, 1979
Maximum:
59.696
jan 1, 2000
At the date of observation
Value
Absolute change
Change from previous value
jan 1, 1978
14.552
+14.552
0.0%
jan 1, 1979
14.374
-0.178
-1.23%
jan 1, 1980
31.564
+17.19
119.59%
jan 1, 1981
20.204
-11.359
-35.99%
jan 1, 1982
16.041
-4.163
-20.61%
jan 1, 1983
18.767
+2.726
16.99%
jan 1, 1984
18.874
+0.107
0.57%
jan 1, 1985
23.682
+4.808
25.47%
jan 1, 1986
22.316
-1.366
-5.77%
jan 1, 1987
28.404
+6.088
27.28%
jan 1, 1988
28.205
-0.198
-0.7%
jan 1, 1989
29.588
+1.382
4.9%
jan 1, 1990
33.112
+3.524
11.91%
jan 1, 1991
38.105
+4.993
15.08%
jan 1, 1992
37.649
-0.456
-1.2%
jan 1, 1993
38.893
+1.244
3.3%
jan 1, 1994
41.885
+2.991
7.69%
jan 1, 1995
41.579
-0.306
-0.73%
jan 1, 1996
46.656
+5.077
12.21%
jan 1, 1997
49.107
+2.451
5.25%
jan 1, 1998
55.958
+6.85
13.95%
jan 1, 1999
55.815
-0.143
-0.26%
jan 1, 2000
59.696
+3.881
6.95%
jan 1, 2001
42.418
-17.278
-28.94%
jan 1, 2002
36.986
-5.432
-12.81%
jan 1, 2003
39.514
+2.528
6.84%
jan 1, 2004
34.89
-4.625
-11.7%
jan 1, 2005
35.73
+0.84
2.41%
jan 1, 2006
36.893
+1.163
3.25%
jan 1, 2007
38.977
+2.084
5.65%
jan 1, 2008
41.012
+2.035
5.22%
jan 1, 2009
39.895
-1.117
-2.72%
jan 1, 2010
36.267
-3.627
-9.09%
jan 1, 2011
41.395
+5.128
14.14%
jan 1, 2012
44.044
+2.649
6.4%
jan 1, 2013
38.954
-5.09
-11.56%
jan 1, 2014
39.148
+0.194
0.5%
Ranking of countries by current statistics by years


Comments: