29
/
en
AIzaSyAYiBZKx7MnpbEhh9jyipgxe19OcubqV5w
April 1, 2024
232892
Samoa
WSM
true
2
1
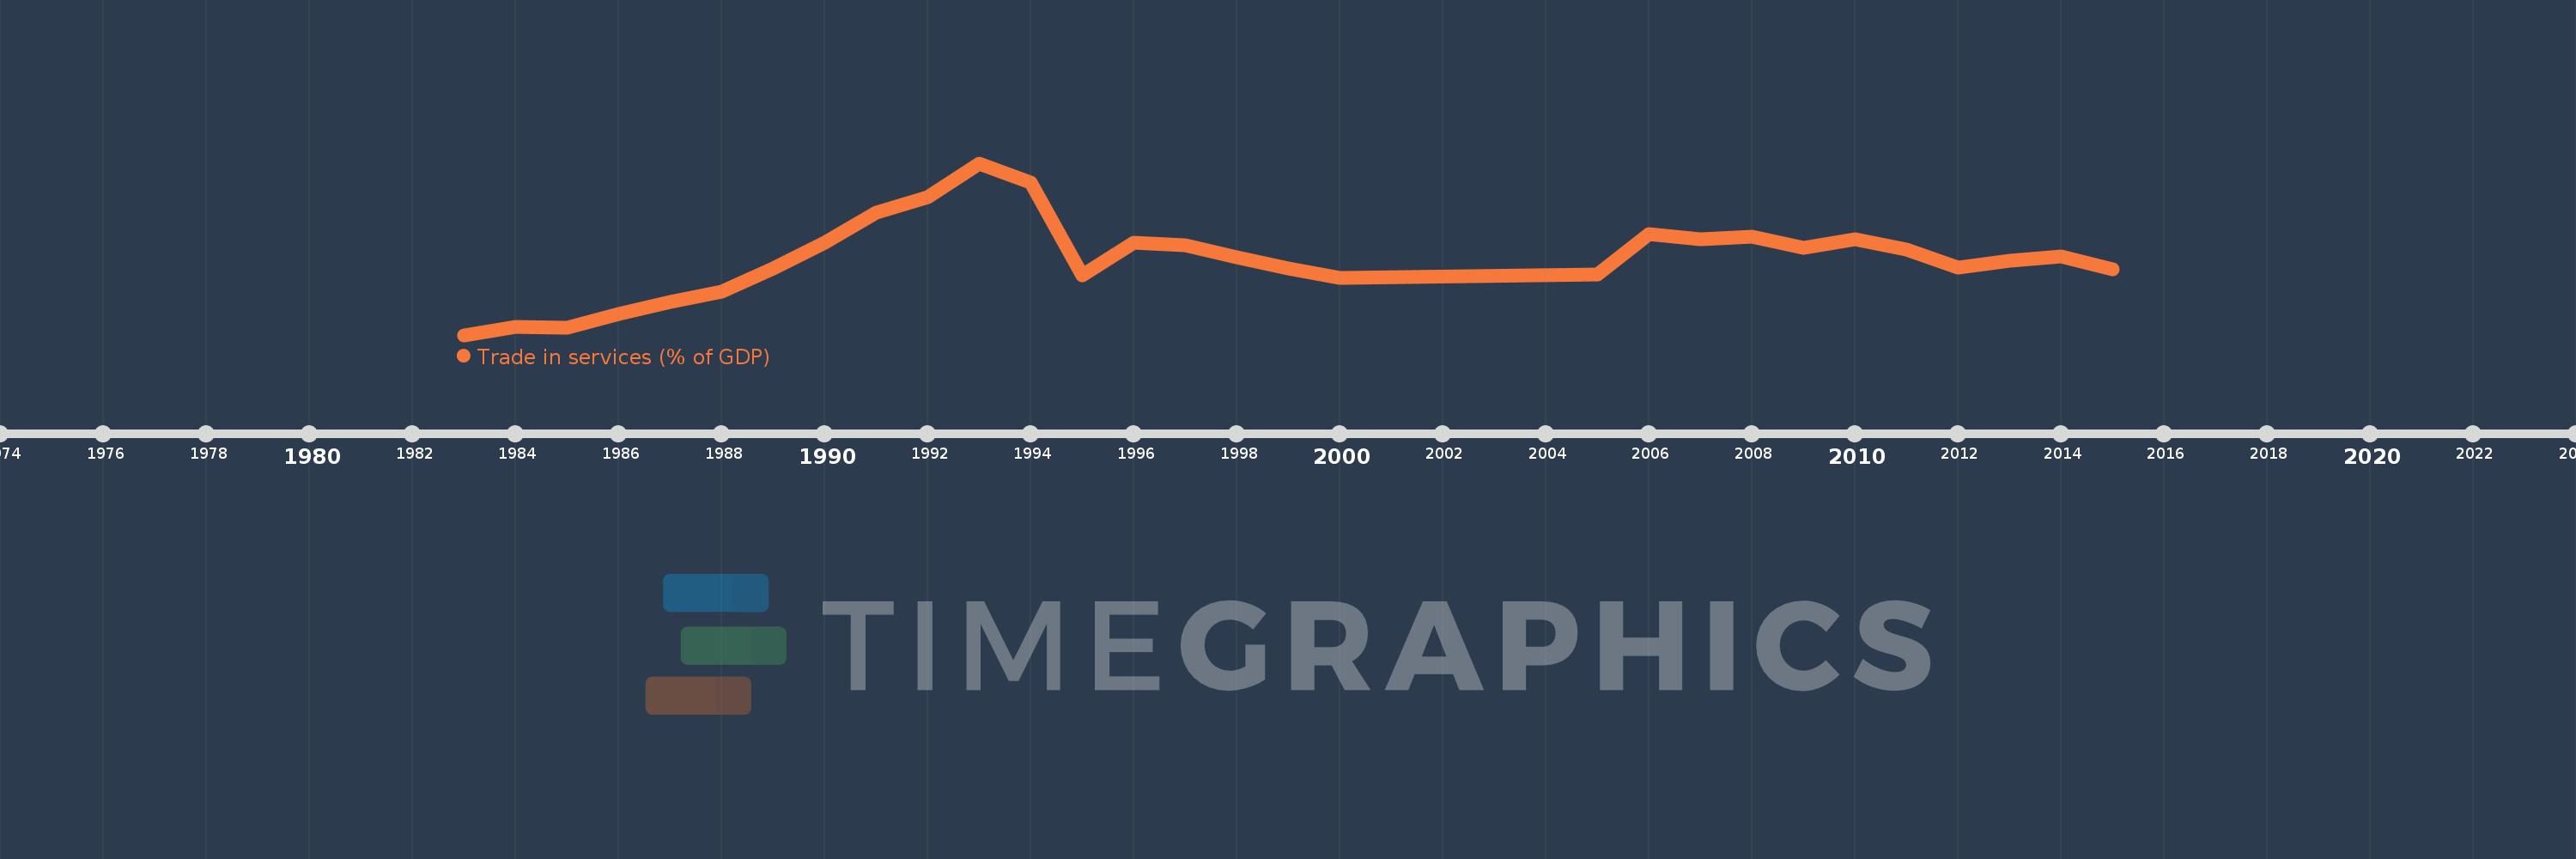
Trade in services (% of GDP)
2015,2014,2013,2012,2011,2010,2009,2008,2007,2006,2005,2000,1999,1998,1997,1996,1995,1994,1993,1992,1991,1990,1989,1988,1987,1986,1985,1984,1983
This statistics in other country:
AfghanistanAlbaniaAlgeriaAngolaAntigua and BarbudaArab WorldArgentinaArmeniaArubaAustraliaAustriaAzerbaijanBahamas, TheBahrainBangladeshBarbadosBelarusBelgiumBelizeBeninBermudaBhutanBoliviaBosnia and HerzegovinaBotswanaBrazilBrunei DarussalamBulgariaBurkina FasoBurundiCabo VerdeCambodiaCameroonCanadaCaribbean small statesCentral African RepublicCentral Europe and the BalticsChadChileChinaColombiaComorosCongo, Dem. Rep.Congo, Rep.Costa RicaCote d'IvoireCroatiaCyprusCzech RepublicDenmarkDjiboutiDominicaDominican RepublicEarly-demographic dividendEast Asia & PacificEast Asia & Pacific (excluding high income)East Asia & Pacific (IDA & IBRD countries)EcuadorEgypt, Arab Rep.El SalvadorEquatorial GuineaEritreaEstoniaEthiopiaEuro areaEurope & Central AsiaEurope & Central Asia (excluding high income)Europe & Central Asia (IDA & IBRD countries)European UnionFaroe IslandsFijiFinlandFragile and conflict affected situationsFranceGabonGambia, TheGeorgiaGermanyGhanaGreeceGrenadaGuatemalaGuineaGuinea-BissauGuyanaHaitiHeavily indebted poor countries (HIPC)High incomeHondurasHong Kong SAR, ChinaHungaryIBRD onlyIcelandIDA & IBRD totalIDA blendIDA onlyIDA totalIndiaIndonesiaIran, Islamic Rep.IraqIrelandIsraelItalyJamaicaJapanJordanKazakhstanKenyaKiribatiKorea, Rep.KosovoKuwaitKyrgyz RepublicLao PDRLate-demographic dividendLatin America & Caribbean Latin America & Caribbean (excluding high income)Latin America & the Caribbean (IDA & IBRD countries)LatviaLeast developed countries: UN classificationLebanonLesothoLiberiaLibyaLithuaniaLow & middle incomeLow incomeLower middle incomeLuxembourgMacao SAR, ChinaMacedonia, FYRMadagascarMalawiMalaysiaMaldivesMaliMaltaMarshall IslandsMauritaniaMauritiusMexicoMicronesia, Fed. Sts.Middle East & North AfricaMiddle East & North Africa (excluding high income)Middle East & North Africa (IDA & IBRD countries)Middle incomeMoldovaMongoliaMontenegroMoroccoMozambiqueMyanmarNamibiaNepalNetherlandsNew ZealandNicaraguaNigerNigeriaNorth AmericaNorwayOECD membersOmanOther small statesPacific island small statesPakistanPalauPanamaPapua New GuineaParaguayPeruPhilippinesPolandPortugalPost-demographic dividendPre-demographic dividendQatarRomaniaRussian FederationRwandaSamoaSao Tome and PrincipeSaudi ArabiaSenegalSerbiaSeychellesSierra LeoneSingaporeSlovak RepublicSloveniaSmall statesSolomon IslandsSouth AfricaSouth AsiaSouth Asia (IDA & IBRD)South SudanSpainSri LankaSt. Kitts and NevisSt. LuciaSt. Vincent and the GrenadinesSub-Saharan Africa Sub-Saharan Africa (excluding high income)Sub-Saharan Africa (IDA & IBRD countries)SudanSurinameSwazilandSwedenSwitzerlandSyrian Arab RepublicTajikistanTanzaniaThailandTimor-LesteTogoTongaTrinidad and TobagoTunisiaTurkeyTuvaluUgandaUkraineUnited KingdomUnited StatesUpper middle incomeUruguayVanuatuVenezuela, RBVietnamWest Bank and GazaWorldYemen, Rep.ZambiaZimbabwe Timeline:
This timeline shows a graph from 1983 to 2015 of Samoa. No data until 1982. Number of actual observations by date: 29.
Source name:
World Development Indicators
Source organization:
International Monetary Fund, Balance of Payments Statistics Yearbook and data files, and World Bank and OECD GDP estimates.
Categories, topics:
Economy & Growth, Private Sector, Trade
Last updated:
apr 23, 2017
Indicators value changes by year
Minimum:
17.198
jan 1, 1983
Maximum:
60.527
jan 1, 1993
At the date of observation
Value
Absolute change
Change from previous value
jan 1, 1983
17.198
+17.198
0.0%
jan 1, 1984
19.291
+2.093
12.17%
jan 1, 1985
18.971
-0.321
-1.66%
jan 1, 1986
22.411
+3.44
18.13%
jan 1, 1987
25.472
+3.062
13.66%
jan 1, 1988
28.077
+2.604
10.22%
jan 1, 1989
33.932
+5.855
20.85%
jan 1, 1990
40.436
+6.505
19.17%
jan 1, 1991
48.062
+7.625
18.86%
jan 1, 1992
52.03
+3.968
8.26%
jan 1, 1993
60.527
+8.497
16.33%
jan 1, 1994
55.618
-4.909
-8.11%
jan 1, 1995
32.186
-23.432
-42.13%
jan 1, 1996
40.422
+8.236
25.59%
jan 1, 1997
39.804
-0.618
-1.53%
jan 1, 1998
36.894
-2.91
-7.31%
jan 1, 1999
34.008
-2.886
-7.82%
jan 1, 2000
31.524
-2.483
-7.3%
jan 1, 2005
32.548
+1.024
3.25%
jan 1, 2006
42.648
+10.099
31.03%
jan 1, 2007
41.374
-1.273
-2.99%
jan 1, 2008
41.897
+0.523
1.26%
jan 1, 2009
39.151
-2.746
-6.55%
jan 1, 2010
41.34
+2.188
5.59%
jan 1, 2011
38.675
-2.664
-6.44%
jan 1, 2012
34.139
-4.537
-11.73%
jan 1, 2013
35.998
+1.859
5.45%
jan 1, 2014
37.092
+1.094
3.04%
jan 1, 2015
33.868
-3.224
-8.69%
Ranking of countries by current statistics by years


Comments: