29
/
en
AIzaSyAYiBZKx7MnpbEhh9jyipgxe19OcubqV5w
April 1, 2024
106741
China
CHN
true
2
1
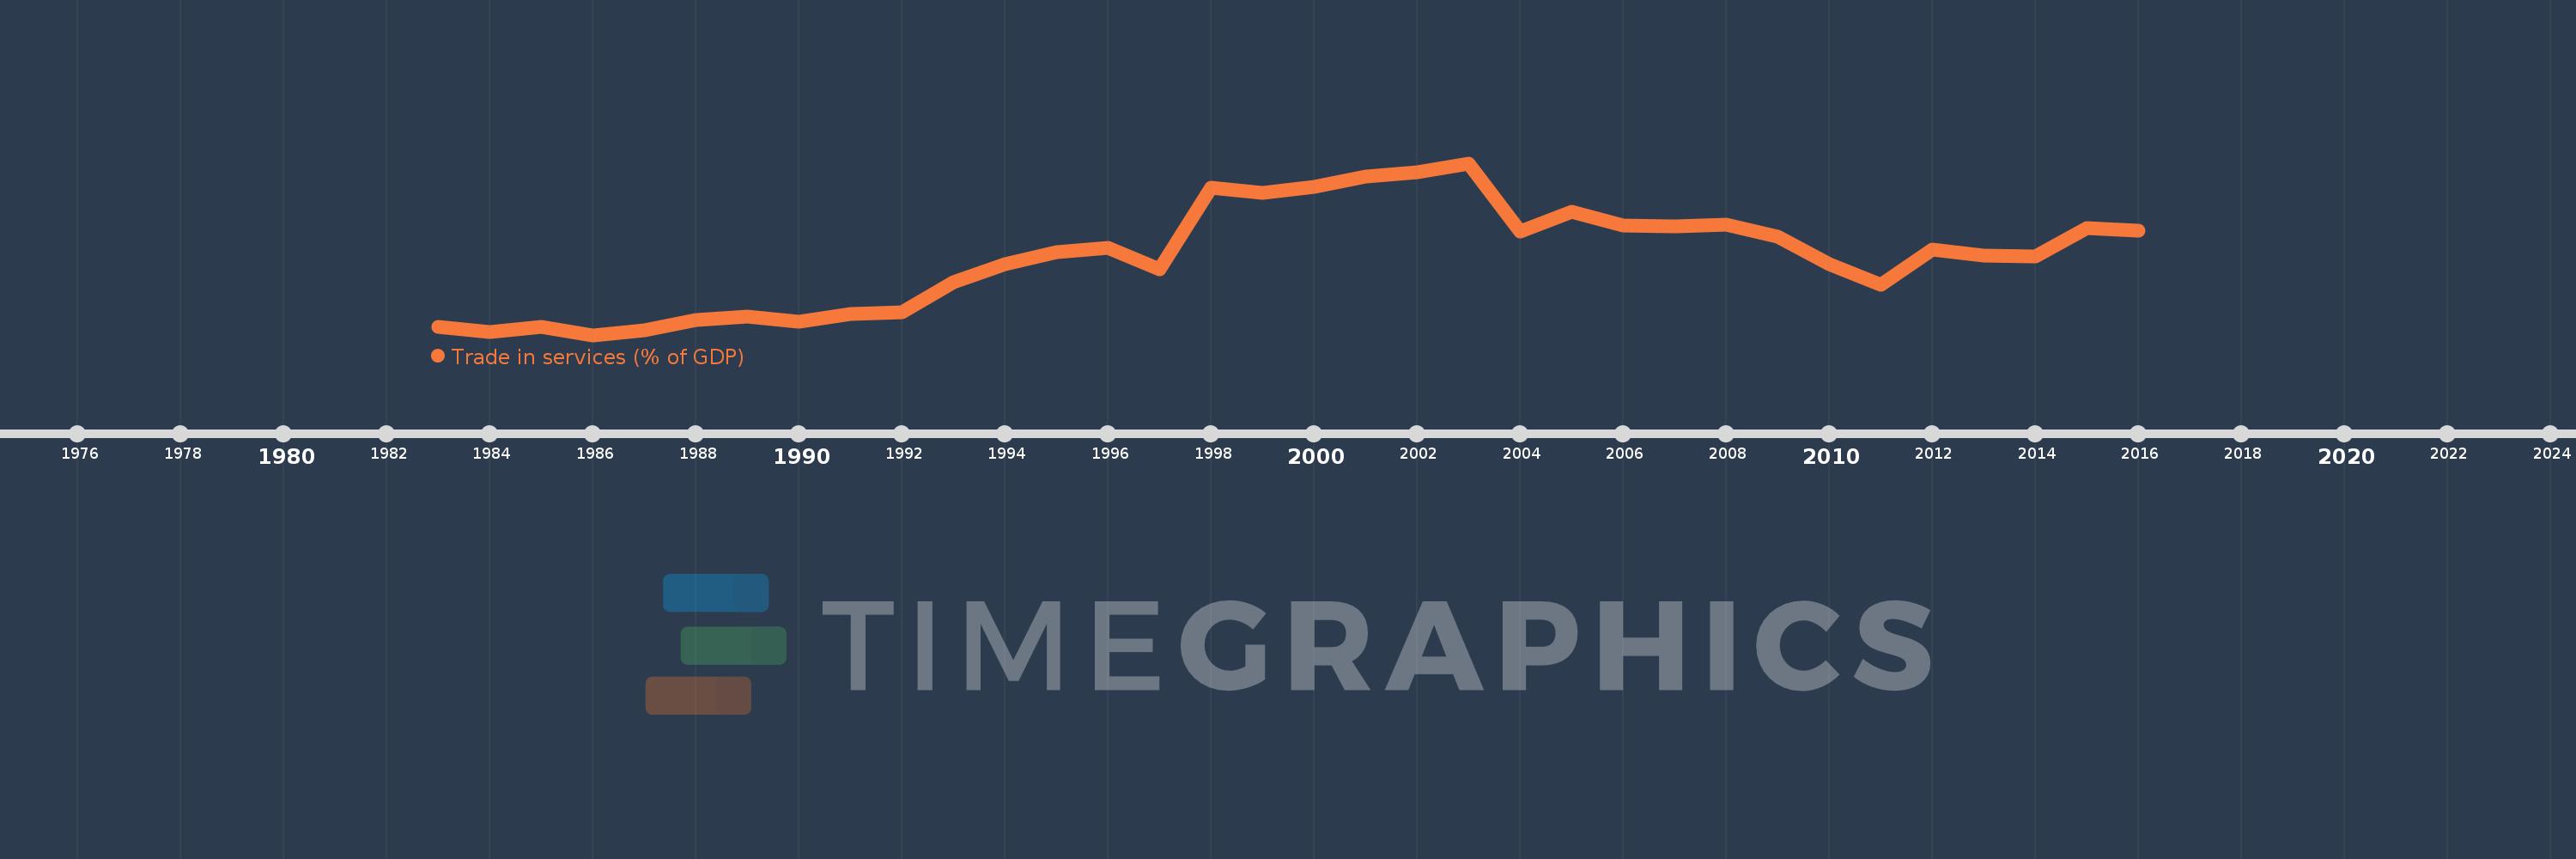
Trade in services (% of GDP)
2016,2015,2014,2013,2012,2011,2010,2009,2008,2007,2006,2005,2004,2003,2002,2001,2000,1999,1998,1997,1996,1995,1994,1993,1992,1991,1990,1989,1988,1987,1986,1985,1984,1983
This statistics in other country:
AfghanistanAlbaniaAlgeriaAngolaAntigua and BarbudaArab WorldArgentinaArmeniaArubaAustraliaAustriaAzerbaijanBahamas, TheBahrainBangladeshBarbadosBelarusBelgiumBelizeBeninBermudaBhutanBoliviaBosnia and HerzegovinaBotswanaBrazilBrunei DarussalamBulgariaBurkina FasoBurundiCabo VerdeCambodiaCameroonCanadaCaribbean small statesCentral African RepublicCentral Europe and the BalticsChadChileChinaColombiaComorosCongo, Dem. Rep.Congo, Rep.Costa RicaCote d'IvoireCroatiaCyprusCzech RepublicDenmarkDjiboutiDominicaDominican RepublicEarly-demographic dividendEast Asia & PacificEast Asia & Pacific (excluding high income)East Asia & Pacific (IDA & IBRD countries)EcuadorEgypt, Arab Rep.El SalvadorEquatorial GuineaEritreaEstoniaEthiopiaEuro areaEurope & Central AsiaEurope & Central Asia (excluding high income)Europe & Central Asia (IDA & IBRD countries)European UnionFaroe IslandsFijiFinlandFragile and conflict affected situationsFranceGabonGambia, TheGeorgiaGermanyGhanaGreeceGrenadaGuatemalaGuineaGuinea-BissauGuyanaHaitiHeavily indebted poor countries (HIPC)High incomeHondurasHong Kong SAR, ChinaHungaryIBRD onlyIcelandIDA & IBRD totalIDA blendIDA onlyIDA totalIndiaIndonesiaIran, Islamic Rep.IraqIrelandIsraelItalyJamaicaJapanJordanKazakhstanKenyaKiribatiKorea, Rep.KosovoKuwaitKyrgyz RepublicLao PDRLate-demographic dividendLatin America & Caribbean Latin America & Caribbean (excluding high income)Latin America & the Caribbean (IDA & IBRD countries)LatviaLeast developed countries: UN classificationLebanonLesothoLiberiaLibyaLithuaniaLow & middle incomeLow incomeLower middle incomeLuxembourgMacao SAR, ChinaMacedonia, FYRMadagascarMalawiMalaysiaMaldivesMaliMaltaMarshall IslandsMauritaniaMauritiusMexicoMicronesia, Fed. Sts.Middle East & North AfricaMiddle East & North Africa (excluding high income)Middle East & North Africa (IDA & IBRD countries)Middle incomeMoldovaMongoliaMontenegroMoroccoMozambiqueMyanmarNamibiaNepalNetherlandsNew ZealandNicaraguaNigerNigeriaNorth AmericaNorwayOECD membersOmanOther small statesPacific island small statesPakistanPalauPanamaPapua New GuineaParaguayPeruPhilippinesPolandPortugalPost-demographic dividendPre-demographic dividendQatarRomaniaRussian FederationRwandaSamoaSao Tome and PrincipeSaudi ArabiaSenegalSerbiaSeychellesSierra LeoneSingaporeSlovak RepublicSloveniaSmall statesSolomon IslandsSouth AfricaSouth AsiaSouth Asia (IDA & IBRD)South SudanSpainSri LankaSt. Kitts and NevisSt. LuciaSt. Vincent and the GrenadinesSub-Saharan Africa Sub-Saharan Africa (excluding high income)Sub-Saharan Africa (IDA & IBRD countries)SudanSurinameSwazilandSwedenSwitzerlandSyrian Arab RepublicTajikistanTanzaniaThailandTimor-LesteTogoTongaTrinidad and TobagoTunisiaTurkeyTuvaluUgandaUkraineUnited KingdomUnited StatesUpper middle incomeUruguayVanuatuVenezuela, RBVietnamWest Bank and GazaWorldYemen, Rep.ZambiaZimbabwe Timeline:
This timeline shows a graph from 1983 to 2016 of China. No data until 1982. Number of actual observations by date: 34.
Source name:
World Development Indicators
Source organization:
International Monetary Fund, Balance of Payments Statistics Yearbook and data files, and World Bank and OECD GDP estimates.
Categories, topics:
Economy & Growth, Private Sector, Trade
Last updated:
apr 23, 2017
Indicators value changes by year
Maximum:
10.127
jan 1, 2003
At the date of observation
Value
Absolute change
Change from previous value
jan 1, 1983
2.212
+2.212
0.0%
jan 1, 1984
1.939
-0.273
-12.33%
jan 1, 1985
2.18
+0.241
12.45%
jan 1, 1986
1.803
-0.378
-17.33%
jan 1, 1987
2.029
+0.227
12.57%
jan 1, 1988
2.536
+0.507
24.96%
jan 1, 1989
2.709
+0.173
6.82%
jan 1, 1990
2.448
-0.261
-9.63%
jan 1, 1991
2.829
+0.381
15.55%
jan 1, 1992
2.895
+0.067
2.36%
jan 1, 1993
4.376
+1.481
51.15%
jan 1, 1994
5.223
+0.847
19.35%
jan 1, 1995
5.833
+0.61
11.68%
jan 1, 1996
6.038
+0.205
3.51%
jan 1, 1997
5.0
-1.038
-17.2%
jan 1, 1998
8.926
+3.926
78.52%
jan 1, 1999
8.705
-0.22
-2.47%
jan 1, 2000
8.976
+0.271
3.11%
jan 1, 2001
9.492
+0.516
5.74%
jan 1, 2002
9.673
+0.182
1.92%
jan 1, 2003
10.127
+0.454
4.69%
jan 1, 2004
6.82
-3.308
-32.66%
jan 1, 2005
7.776
+0.956
14.02%
jan 1, 2006
7.106
-0.67
-8.61%
jan 1, 2007
7.082
-0.024
-0.34%
jan 1, 2008
7.167
+0.085
1.19%
jan 1, 2009
6.562
-0.605
-8.44%
jan 1, 2010
5.255
-1.307
-19.91%
jan 1, 2011
4.237
-1.019
-19.38%
jan 1, 2012
5.928
+1.691
39.92%
jan 1, 2013
5.641
-0.287
-4.84%
jan 1, 2014
5.596
-0.045
-0.79%
jan 1, 2015
6.996
+1.4
25.01%
jan 1, 2016
6.863
-0.133
-1.9%
Ranking of countries by current statistics by years


Comments: