29
/
en
AIzaSyAYiBZKx7MnpbEhh9jyipgxe19OcubqV5w
April 1, 2024
145199
Guatemala
GTM
true
2
1
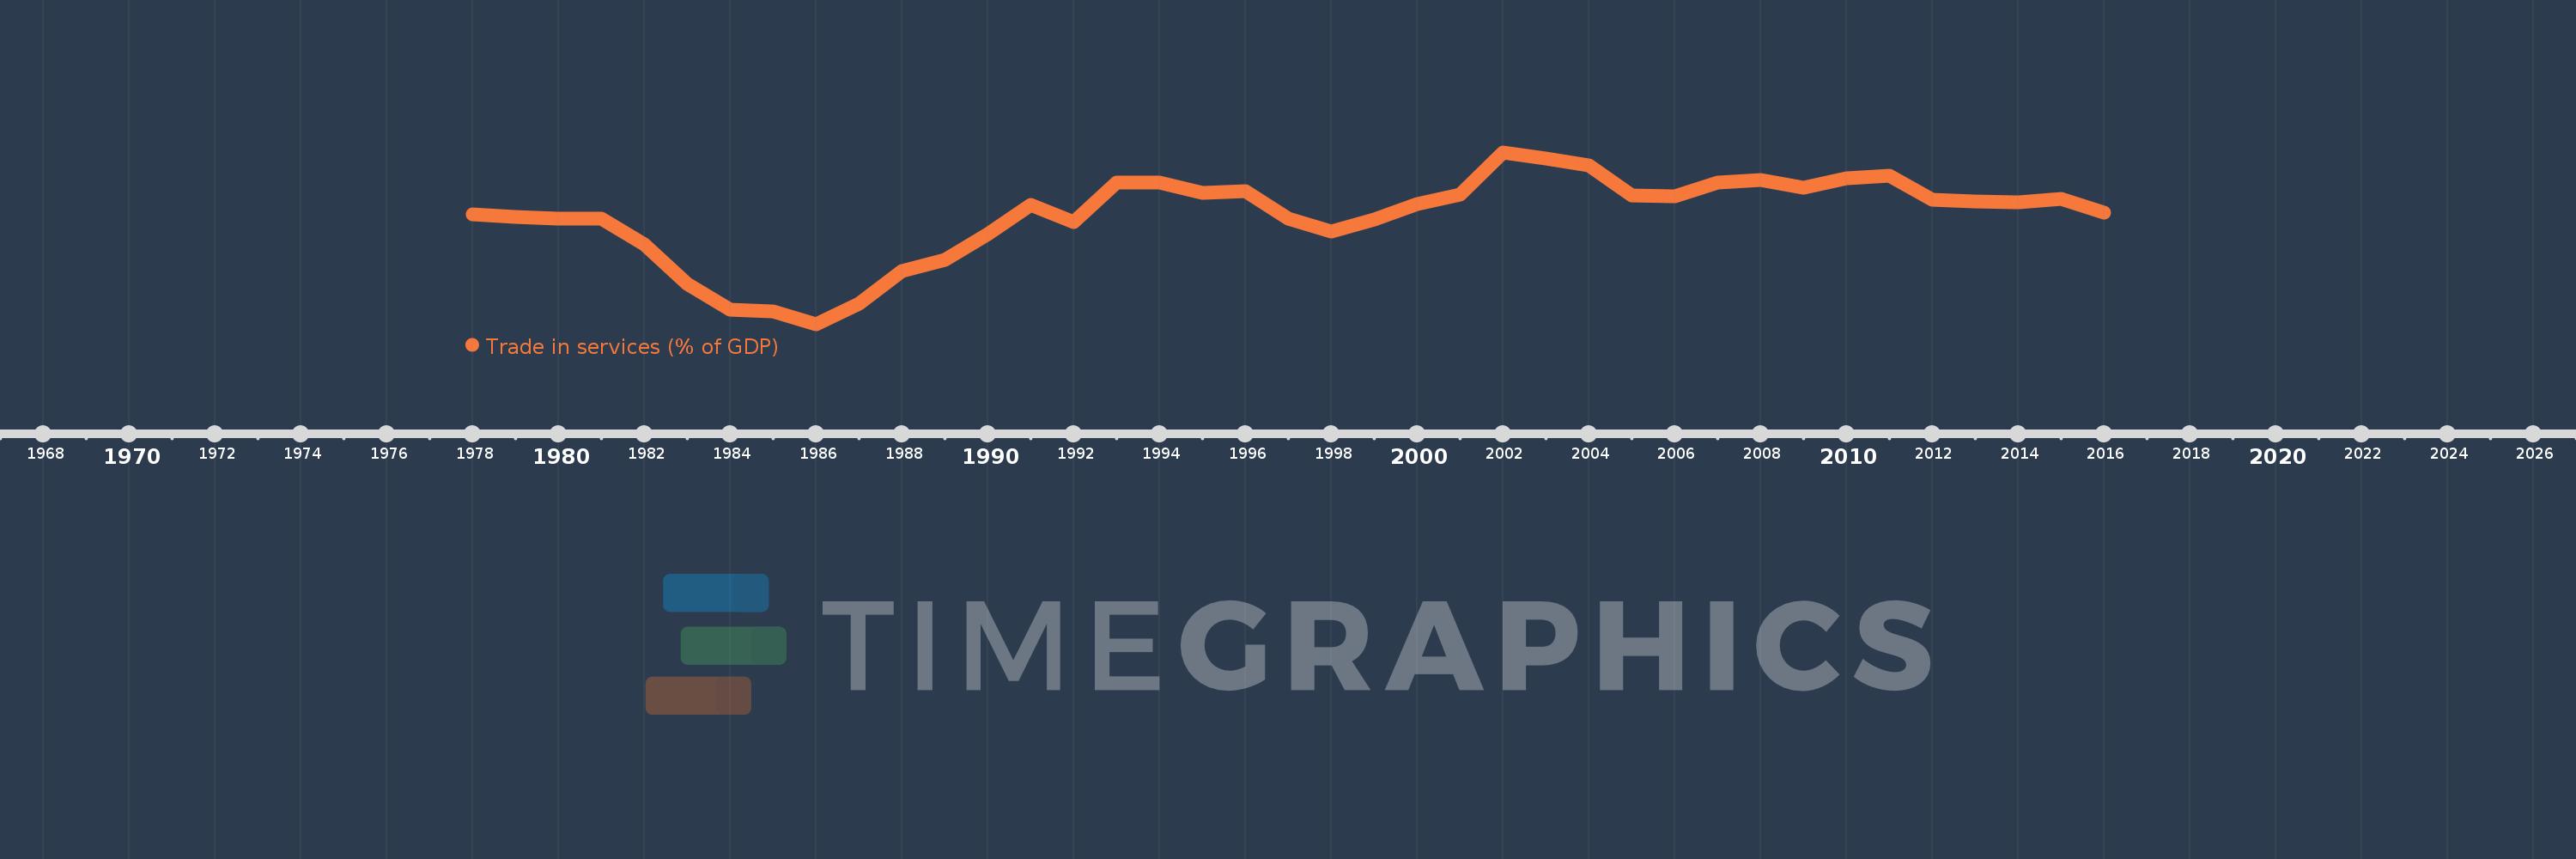
Trade in services (% of GDP)
2016,2015,2014,2013,2012,2011,2010,2009,2008,2007,2006,2005,2004,2003,2002,2001,2000,1999,1998,1997,1996,1995,1994,1993,1992,1991,1990,1989,1988,1987,1986,1985,1984,1983,1982,1981,1980,1979,1978
This statistics in other country:
AfghanistanAlbaniaAlgeriaAngolaAntigua and BarbudaArab WorldArgentinaArmeniaArubaAustraliaAustriaAzerbaijanBahamas, TheBahrainBangladeshBarbadosBelarusBelgiumBelizeBeninBermudaBhutanBoliviaBosnia and HerzegovinaBotswanaBrazilBrunei DarussalamBulgariaBurkina FasoBurundiCabo VerdeCambodiaCameroonCanadaCaribbean small statesCentral African RepublicCentral Europe and the BalticsChadChileChinaColombiaComorosCongo, Dem. Rep.Congo, Rep.Costa RicaCote d'IvoireCroatiaCyprusCzech RepublicDenmarkDjiboutiDominicaDominican RepublicEarly-demographic dividendEast Asia & PacificEast Asia & Pacific (excluding high income)East Asia & Pacific (IDA & IBRD countries)EcuadorEgypt, Arab Rep.El SalvadorEquatorial GuineaEritreaEstoniaEthiopiaEuro areaEurope & Central AsiaEurope & Central Asia (excluding high income)Europe & Central Asia (IDA & IBRD countries)European UnionFaroe IslandsFijiFinlandFragile and conflict affected situationsFranceGabonGambia, TheGeorgiaGermanyGhanaGreeceGrenadaGuatemalaGuineaGuinea-BissauGuyanaHaitiHeavily indebted poor countries (HIPC)High incomeHondurasHong Kong SAR, ChinaHungaryIBRD onlyIcelandIDA & IBRD totalIDA blendIDA onlyIDA totalIndiaIndonesiaIran, Islamic Rep.IraqIrelandIsraelItalyJamaicaJapanJordanKazakhstanKenyaKiribatiKorea, Rep.KosovoKuwaitKyrgyz RepublicLao PDRLate-demographic dividendLatin America & Caribbean Latin America & Caribbean (excluding high income)Latin America & the Caribbean (IDA & IBRD countries)LatviaLeast developed countries: UN classificationLebanonLesothoLiberiaLibyaLithuaniaLow & middle incomeLow incomeLower middle incomeLuxembourgMacao SAR, ChinaMacedonia, FYRMadagascarMalawiMalaysiaMaldivesMaliMaltaMarshall IslandsMauritaniaMauritiusMexicoMicronesia, Fed. Sts.Middle East & North AfricaMiddle East & North Africa (excluding high income)Middle East & North Africa (IDA & IBRD countries)Middle incomeMoldovaMongoliaMontenegroMoroccoMozambiqueMyanmarNamibiaNepalNetherlandsNew ZealandNicaraguaNigerNigeriaNorth AmericaNorwayOECD membersOmanOther small statesPacific island small statesPakistanPalauPanamaPapua New GuineaParaguayPeruPhilippinesPolandPortugalPost-demographic dividendPre-demographic dividendQatarRomaniaRussian FederationRwandaSamoaSao Tome and PrincipeSaudi ArabiaSenegalSerbiaSeychellesSierra LeoneSingaporeSlovak RepublicSloveniaSmall statesSolomon IslandsSouth AfricaSouth AsiaSouth Asia (IDA & IBRD)South SudanSpainSri LankaSt. Kitts and NevisSt. LuciaSt. Vincent and the GrenadinesSub-Saharan Africa Sub-Saharan Africa (excluding high income)Sub-Saharan Africa (IDA & IBRD countries)SudanSurinameSwazilandSwedenSwitzerlandSyrian Arab RepublicTajikistanTanzaniaThailandTimor-LesteTogoTongaTrinidad and TobagoTunisiaTurkeyTuvaluUgandaUkraineUnited KingdomUnited StatesUpper middle incomeUruguayVanuatuVenezuela, RBVietnamWest Bank and GazaWorldYemen, Rep.ZambiaZimbabwe Timeline:
This timeline shows a graph from 1978 to 2016 of Guatemala. No data until 1977. Number of actual observations by date: 39.
Source name:
World Development Indicators
Source organization:
International Monetary Fund, Balance of Payments Statistics Yearbook and data files, and World Bank and OECD GDP estimates.
Categories, topics:
Economy & Growth, Private Sector, Trade
Last updated:
apr 23, 2017
Indicators value changes by year
Maximum:
12.642
jan 1, 2002
At the date of observation
Value
Absolute change
Change from previous value
jan 1, 1978
9.142
+9.142
0.0%
jan 1, 1979
8.974
-0.167
-1.83%
jan 1, 1980
8.86
-0.114
-1.27%
jan 1, 1981
8.867
+0.007
0.07%
jan 1, 1982
7.428
-1.439
-16.22%
jan 1, 1983
5.157
-2.272
-30.58%
jan 1, 1984
3.736
-1.421
-27.55%
jan 1, 1985
3.606
-0.13
-3.47%
jan 1, 1986
2.891
-0.715
-19.82%
jan 1, 1987
4.063
+1.171
40.5%
jan 1, 1988
5.897
+1.835
45.17%
jan 1, 1989
6.551
+0.653
11.08%
jan 1, 1990
8.021
+1.47
22.44%
jan 1, 1991
9.67
+1.65
20.57%
jan 1, 1992
8.667
-1.004
-10.38%
jan 1, 1993
10.912
+2.245
25.91%
jan 1, 1994
10.934
+0.022
0.2%
jan 1, 1995
10.339
-0.595
-5.44%
jan 1, 1996
10.422
+0.083
0.8%
jan 1, 1997
8.9
-1.522
-14.61%
jan 1, 1998
8.159
-0.741
-8.32%
jan 1, 1999
8.851
+0.692
8.48%
jan 1, 2000
9.705
+0.854
9.65%
jan 1, 2001
10.228
+0.523
5.39%
jan 1, 2002
12.642
+2.414
23.6%
jan 1, 2003
12.308
-0.334
-2.64%
jan 1, 2004
11.922
-0.386
-3.14%
jan 1, 2005
10.201
-1.721
-14.44%
jan 1, 2006
10.133
-0.068
-0.66%
jan 1, 2007
10.907
+0.774
7.64%
jan 1, 2008
11.059
+0.152
1.39%
jan 1, 2009
10.634
-0.424
-3.84%
jan 1, 2010
11.184
+0.55
5.17%
jan 1, 2011
11.309
+0.125
1.12%
jan 1, 2012
9.979
-1.33
-11.76%
jan 1, 2013
9.872
-0.107
-1.08%
jan 1, 2014
9.824
-0.048
-0.48%
jan 1, 2015
9.985
+0.161
1.63%
jan 1, 2016
9.244
-0.741
-7.42%
Ranking of countries by current statistics by years


Comments: