29
/
en
AIzaSyAYiBZKx7MnpbEhh9jyipgxe19OcubqV5w
April 1, 2024
100704
Cameroon
CMR
true
2
1
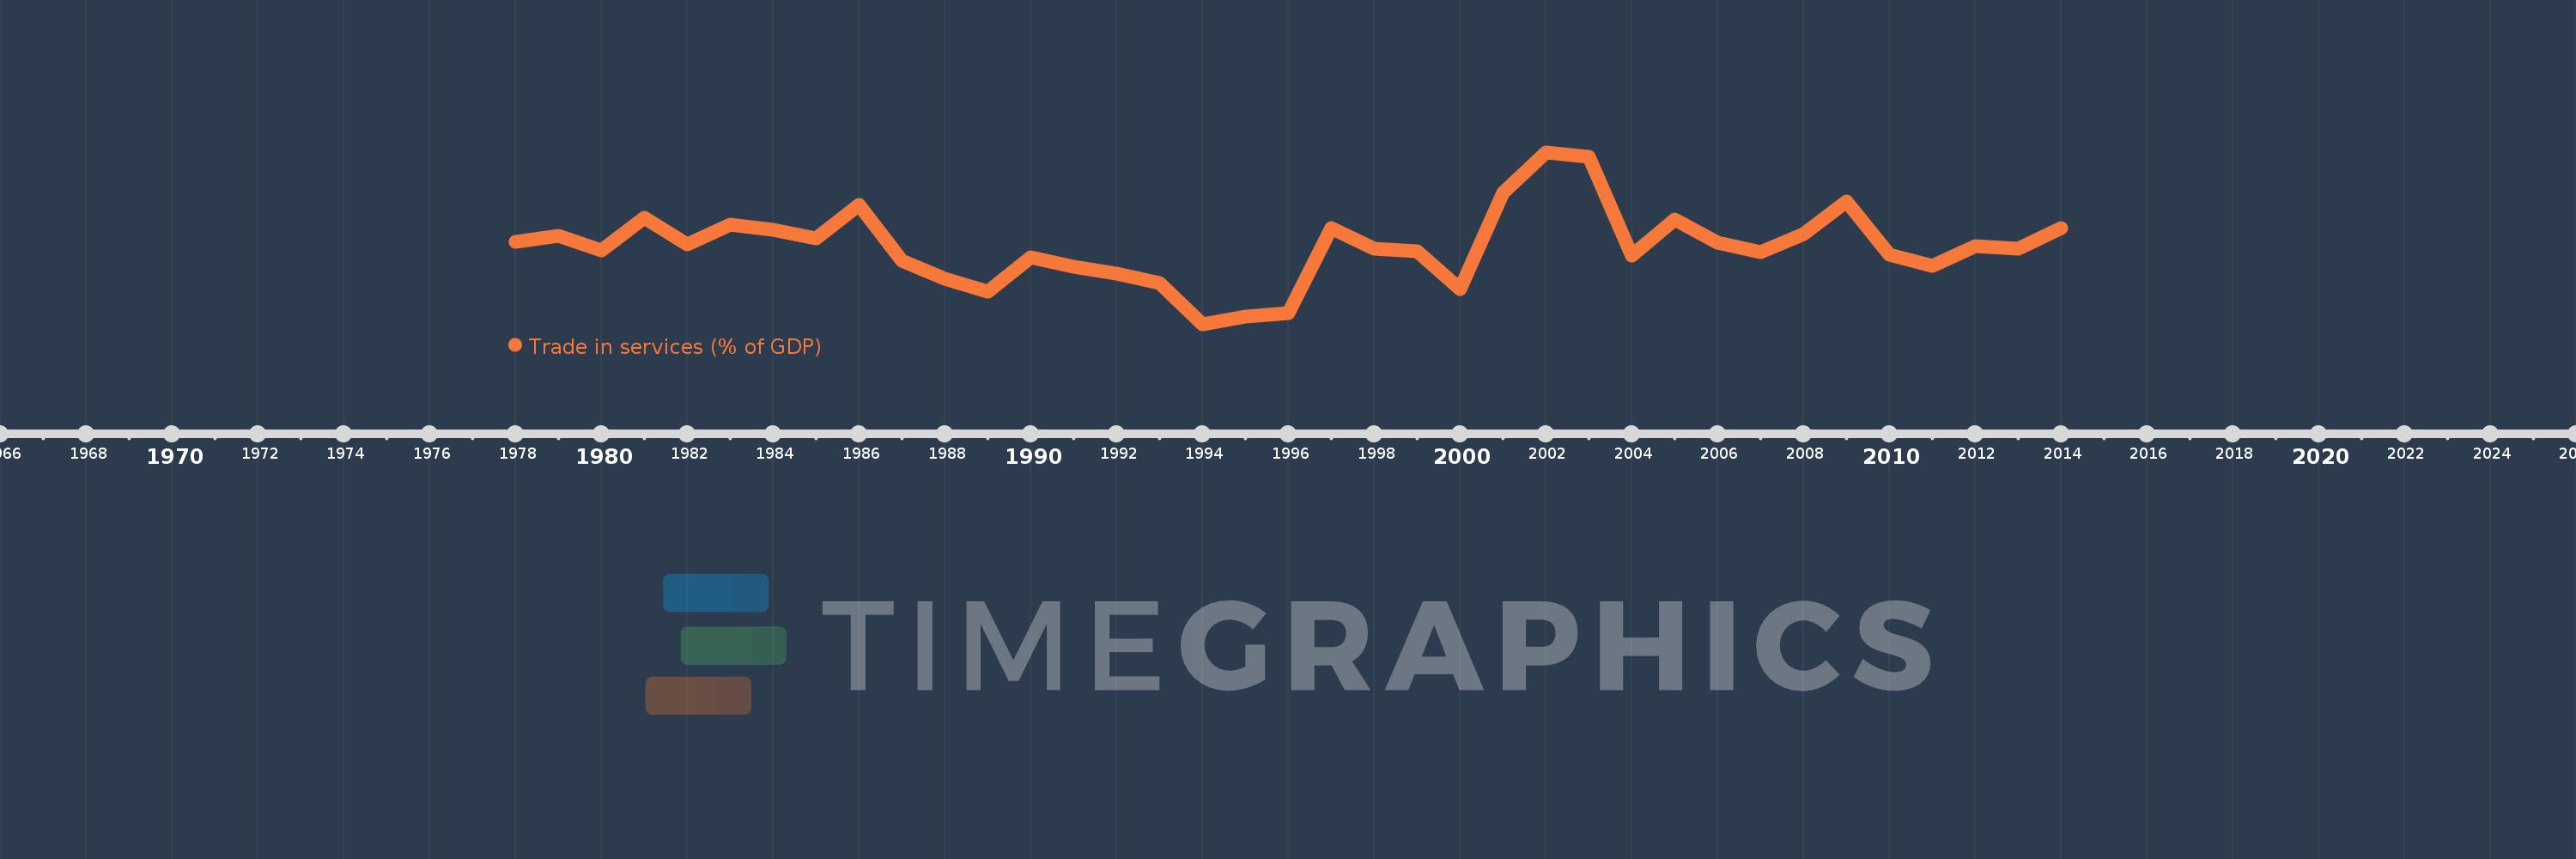
Trade in services (% of GDP)
2014,2013,2012,2011,2010,2009,2008,2007,2006,2005,2004,2003,2002,2001,2000,1999,1998,1997,1996,1995,1994,1993,1992,1991,1990,1989,1988,1987,1986,1985,1984,1983,1982,1981,1980,1979,1978
This statistics in other country:
AfghanistanAlbaniaAlgeriaAngolaAntigua and BarbudaArab WorldArgentinaArmeniaArubaAustraliaAustriaAzerbaijanBahamas, TheBahrainBangladeshBarbadosBelarusBelgiumBelizeBeninBermudaBhutanBoliviaBosnia and HerzegovinaBotswanaBrazilBrunei DarussalamBulgariaBurkina FasoBurundiCabo VerdeCambodiaCameroonCanadaCaribbean small statesCentral African RepublicCentral Europe and the BalticsChadChileChinaColombiaComorosCongo, Dem. Rep.Congo, Rep.Costa RicaCote d'IvoireCroatiaCyprusCzech RepublicDenmarkDjiboutiDominicaDominican RepublicEarly-demographic dividendEast Asia & PacificEast Asia & Pacific (excluding high income)East Asia & Pacific (IDA & IBRD countries)EcuadorEgypt, Arab Rep.El SalvadorEquatorial GuineaEritreaEstoniaEthiopiaEuro areaEurope & Central AsiaEurope & Central Asia (excluding high income)Europe & Central Asia (IDA & IBRD countries)European UnionFaroe IslandsFijiFinlandFragile and conflict affected situationsFranceGabonGambia, TheGeorgiaGermanyGhanaGreeceGrenadaGuatemalaGuineaGuinea-BissauGuyanaHaitiHeavily indebted poor countries (HIPC)High incomeHondurasHong Kong SAR, ChinaHungaryIBRD onlyIcelandIDA & IBRD totalIDA blendIDA onlyIDA totalIndiaIndonesiaIran, Islamic Rep.IraqIrelandIsraelItalyJamaicaJapanJordanKazakhstanKenyaKiribatiKorea, Rep.KosovoKuwaitKyrgyz RepublicLao PDRLate-demographic dividendLatin America & Caribbean Latin America & Caribbean (excluding high income)Latin America & the Caribbean (IDA & IBRD countries)LatviaLeast developed countries: UN classificationLebanonLesothoLiberiaLibyaLithuaniaLow & middle incomeLow incomeLower middle incomeLuxembourgMacao SAR, ChinaMacedonia, FYRMadagascarMalawiMalaysiaMaldivesMaliMaltaMarshall IslandsMauritaniaMauritiusMexicoMicronesia, Fed. Sts.Middle East & North AfricaMiddle East & North Africa (excluding high income)Middle East & North Africa (IDA & IBRD countries)Middle incomeMoldovaMongoliaMontenegroMoroccoMozambiqueMyanmarNamibiaNepalNetherlandsNew ZealandNicaraguaNigerNigeriaNorth AmericaNorwayOECD membersOmanOther small statesPacific island small statesPakistanPalauPanamaPapua New GuineaParaguayPeruPhilippinesPolandPortugalPost-demographic dividendPre-demographic dividendQatarRomaniaRussian FederationRwandaSamoaSao Tome and PrincipeSaudi ArabiaSenegalSerbiaSeychellesSierra LeoneSingaporeSlovak RepublicSloveniaSmall statesSolomon IslandsSouth AfricaSouth AsiaSouth Asia (IDA & IBRD)South SudanSpainSri LankaSt. Kitts and NevisSt. LuciaSt. Vincent and the GrenadinesSub-Saharan Africa Sub-Saharan Africa (excluding high income)Sub-Saharan Africa (IDA & IBRD countries)SudanSurinameSwazilandSwedenSwitzerlandSyrian Arab RepublicTajikistanTanzaniaThailandTimor-LesteTogoTongaTrinidad and TobagoTunisiaTurkeyTuvaluUgandaUkraineUnited KingdomUnited StatesUpper middle incomeUruguayVanuatuVenezuela, RBVietnamWest Bank and GazaWorldYemen, Rep.ZambiaZimbabwe Timeline:
This timeline shows a graph from 1978 to 2014 of Cameroon. No data until 1977. Number of actual observations by date: 37.
Source name:
World Development Indicators
Source organization:
International Monetary Fund, Balance of Payments Statistics Yearbook and data files, and World Bank and OECD GDP estimates.
Categories, topics:
Economy & Growth, Private Sector, Trade
Last updated:
apr 23, 2017
Indicators value changes by year
Maximum:
21.664
jan 1, 2002
At the date of observation
Value
Absolute change
Change from previous value
jan 1, 1978
14.761
+14.761
0.0%
jan 1, 1979
15.205
+0.444
3.01%
jan 1, 1980
14.045
-1.16
-7.63%
jan 1, 1981
16.583
+2.538
18.07%
jan 1, 1982
14.573
-2.01
-12.12%
jan 1, 1983
16.105
+1.533
10.52%
jan 1, 1984
15.687
-0.418
-2.6%
jan 1, 1985
15.003
-0.685
-4.36%
jan 1, 1986
17.609
+2.607
17.37%
jan 1, 1987
13.287
-4.322
-24.54%
jan 1, 1988
11.899
-1.388
-10.45%
jan 1, 1989
10.888
-1.011
-8.49%
jan 1, 1990
13.538
+2.65
24.34%
jan 1, 1991
12.799
-0.739
-5.46%
jan 1, 1992
12.291
-0.508
-3.97%
jan 1, 1993
11.537
-0.754
-6.13%
jan 1, 1994
8.366
-3.171
-27.49%
jan 1, 1995
8.936
+0.571
6.82%
jan 1, 1996
9.195
+0.259
2.89%
jan 1, 1997
15.809
+6.614
71.93%
jan 1, 1998
14.192
-1.617
-10.23%
jan 1, 1999
14.021
-0.171
-1.21%
jan 1, 2000
11.103
-2.918
-20.81%
jan 1, 2001
18.517
+7.415
66.79%
jan 1, 2002
21.664
+3.147
16.99%
jan 1, 2003
21.333
-0.332
-1.53%
jan 1, 2004
13.707
-7.626
-35.75%
jan 1, 2005
16.487
+2.781
20.29%
jan 1, 2006
14.667
-1.82
-11.04%
jan 1, 2007
13.935
-0.732
-4.99%
jan 1, 2008
15.34
+1.405
10.08%
jan 1, 2009
17.879
+2.538
16.55%
jan 1, 2010
13.73
-4.149
-23.21%
jan 1, 2011
12.869
-0.86
-6.27%
jan 1, 2012
14.442
+1.573
12.22%
jan 1, 2013
14.192
-0.25
-1.73%
jan 1, 2014
15.827
+1.636
11.53%
Ranking of countries by current statistics by years


Comments: