29
/
en
AIzaSyAYiBZKx7MnpbEhh9jyipgxe19OcubqV5w
April 1, 2024
236583
Senegal
SEN
true
2
1
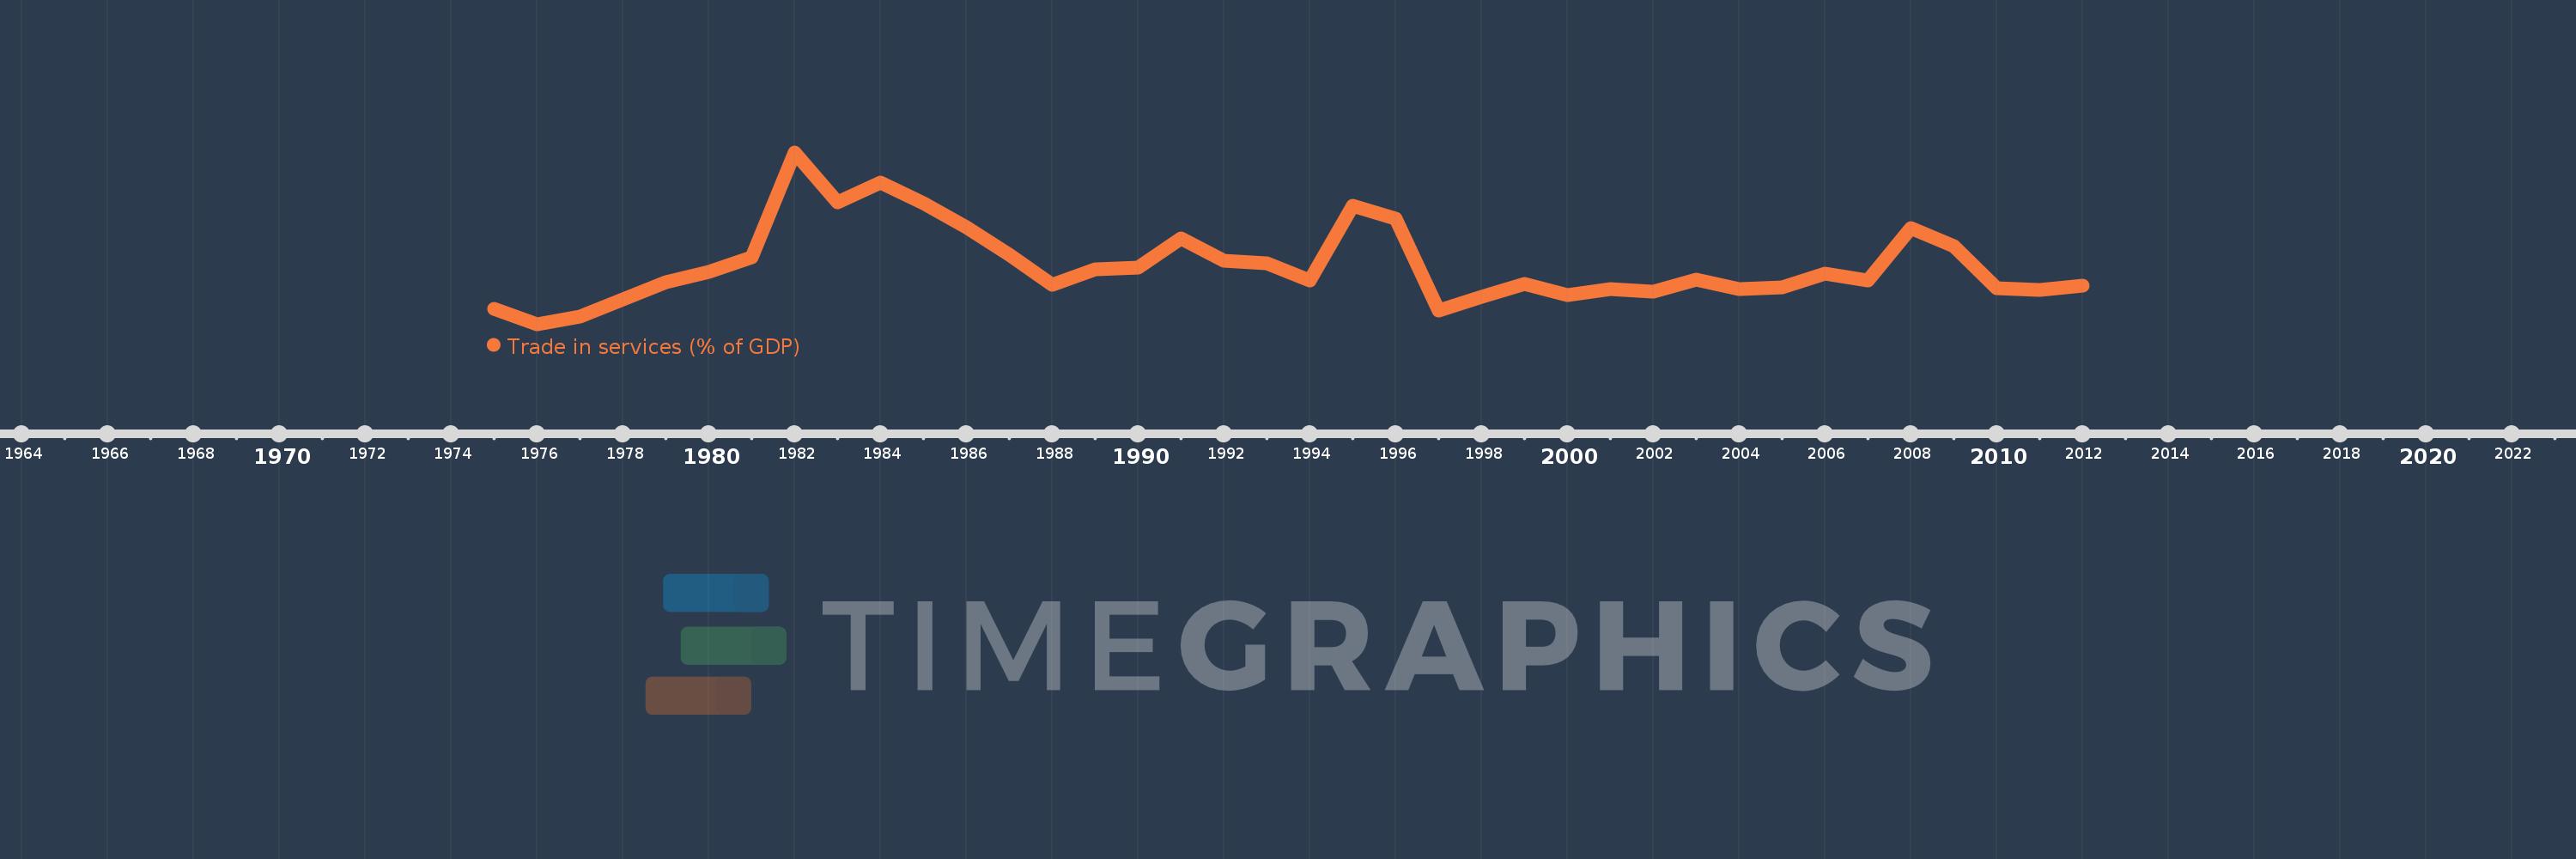
Trade in services (% of GDP)
2012,2011,2010,2009,2008,2007,2006,2005,2004,2003,2002,2001,2000,1999,1998,1997,1996,1995,1994,1993,1992,1991,1990,1989,1988,1987,1986,1985,1984,1983,1982,1981,1980,1979,1978,1977,1976,1975
This statistics in other country:
AfghanistanAlbaniaAlgeriaAngolaAntigua and BarbudaArab WorldArgentinaArmeniaArubaAustraliaAustriaAzerbaijanBahamas, TheBahrainBangladeshBarbadosBelarusBelgiumBelizeBeninBermudaBhutanBoliviaBosnia and HerzegovinaBotswanaBrazilBrunei DarussalamBulgariaBurkina FasoBurundiCabo VerdeCambodiaCameroonCanadaCaribbean small statesCentral African RepublicCentral Europe and the BalticsChadChileChinaColombiaComorosCongo, Dem. Rep.Congo, Rep.Costa RicaCote d'IvoireCroatiaCyprusCzech RepublicDenmarkDjiboutiDominicaDominican RepublicEarly-demographic dividendEast Asia & PacificEast Asia & Pacific (excluding high income)East Asia & Pacific (IDA & IBRD countries)EcuadorEgypt, Arab Rep.El SalvadorEquatorial GuineaEritreaEstoniaEthiopiaEuro areaEurope & Central AsiaEurope & Central Asia (excluding high income)Europe & Central Asia (IDA & IBRD countries)European UnionFaroe IslandsFijiFinlandFragile and conflict affected situationsFranceGabonGambia, TheGeorgiaGermanyGhanaGreeceGrenadaGuatemalaGuineaGuinea-BissauGuyanaHaitiHeavily indebted poor countries (HIPC)High incomeHondurasHong Kong SAR, ChinaHungaryIBRD onlyIcelandIDA & IBRD totalIDA blendIDA onlyIDA totalIndiaIndonesiaIran, Islamic Rep.IraqIrelandIsraelItalyJamaicaJapanJordanKazakhstanKenyaKiribatiKorea, Rep.KosovoKuwaitKyrgyz RepublicLao PDRLate-demographic dividendLatin America & Caribbean Latin America & Caribbean (excluding high income)Latin America & the Caribbean (IDA & IBRD countries)LatviaLeast developed countries: UN classificationLebanonLesothoLiberiaLibyaLithuaniaLow & middle incomeLow incomeLower middle incomeLuxembourgMacao SAR, ChinaMacedonia, FYRMadagascarMalawiMalaysiaMaldivesMaliMaltaMarshall IslandsMauritaniaMauritiusMexicoMicronesia, Fed. Sts.Middle East & North AfricaMiddle East & North Africa (excluding high income)Middle East & North Africa (IDA & IBRD countries)Middle incomeMoldovaMongoliaMontenegroMoroccoMozambiqueMyanmarNamibiaNepalNetherlandsNew ZealandNicaraguaNigerNigeriaNorth AmericaNorwayOECD membersOmanOther small statesPacific island small statesPakistanPalauPanamaPapua New GuineaParaguayPeruPhilippinesPolandPortugalPost-demographic dividendPre-demographic dividendQatarRomaniaRussian FederationRwandaSamoaSao Tome and PrincipeSaudi ArabiaSenegalSerbiaSeychellesSierra LeoneSingaporeSlovak RepublicSloveniaSmall statesSolomon IslandsSouth AfricaSouth AsiaSouth Asia (IDA & IBRD)South SudanSpainSri LankaSt. Kitts and NevisSt. LuciaSt. Vincent and the GrenadinesSub-Saharan Africa Sub-Saharan Africa (excluding high income)Sub-Saharan Africa (IDA & IBRD countries)SudanSurinameSwazilandSwedenSwitzerlandSyrian Arab RepublicTajikistanTanzaniaThailandTimor-LesteTogoTongaTrinidad and TobagoTunisiaTurkeyTuvaluUgandaUkraineUnited KingdomUnited StatesUpper middle incomeUruguayVanuatuVenezuela, RBVietnamWest Bank and GazaWorldYemen, Rep.ZambiaZimbabwe Timeline:
This timeline shows a graph from 1975 to 2012 of Senegal. No data until 1974. Number of actual observations by date: 38.
Source name:
World Development Indicators
Source organization:
International Monetary Fund, Balance of Payments Statistics Yearbook and data files, and World Bank and OECD GDP estimates.
Categories, topics:
Economy & Growth, Private Sector, Trade
Last updated:
apr 23, 2017
Indicators value changes by year
Minimum:
14.131
jan 1, 1976
Maximum:
27.521
jan 1, 1982
At the date of observation
Value
Absolute change
Change from previous value
jan 1, 1975
15.31
+15.31
0.0%
jan 1, 1976
14.131
-1.179
-7.7%
jan 1, 1977
14.738
+0.607
4.29%
jan 1, 1978
16.058
+1.321
8.96%
jan 1, 1979
17.414
+1.355
8.44%
jan 1, 1980
18.178
+0.764
4.39%
jan 1, 1981
19.313
+1.135
6.25%
jan 1, 1982
27.521
+8.208
42.5%
jan 1, 1983
23.614
-3.907
-14.2%
jan 1, 1984
25.158
+1.544
6.54%
jan 1, 1985
23.595
-1.563
-6.21%
jan 1, 1986
21.707
-1.888
-8.0%
jan 1, 1987
19.552
-2.155
-9.93%
jan 1, 1988
17.208
-2.345
-11.99%
jan 1, 1989
18.403
+1.195
6.95%
jan 1, 1990
18.566
+0.163
0.89%
jan 1, 1991
20.823
+2.256
12.15%
jan 1, 1992
19.071
-1.752
-8.41%
jan 1, 1993
18.911
-0.16
-0.84%
jan 1, 1994
17.525
-1.386
-7.33%
jan 1, 1995
23.343
+5.818
33.2%
jan 1, 1996
22.357
-0.986
-4.23%
jan 1, 1997
15.202
-7.155
-32.0%
jan 1, 1998
16.265
+1.063
6.99%
jan 1, 1999
17.285
+1.02
6.27%
jan 1, 2000
16.433
-0.852
-4.93%
jan 1, 2001
16.877
+0.444
2.7%
jan 1, 2002
16.649
-0.228
-1.35%
jan 1, 2003
17.639
+0.989
5.94%
jan 1, 2004
16.89
-0.749
-4.24%
jan 1, 2005
16.979
+0.089
0.53%
jan 1, 2006
18.056
+1.077
6.34%
jan 1, 2007
17.562
-0.494
-2.74%
jan 1, 2008
21.613
+4.051
23.07%
jan 1, 2009
20.22
-1.393
-6.45%
jan 1, 2010
16.965
-3.255
-16.1%
jan 1, 2011
16.781
-0.184
-1.08%
jan 1, 2012
17.124
+0.343
2.04%
Ranking of countries by current statistics by years


Comments: