29
/
en
AIzaSyAYiBZKx7MnpbEhh9jyipgxe19OcubqV5w
April 1, 2024
270169
Turkey
TUR
true
2
1
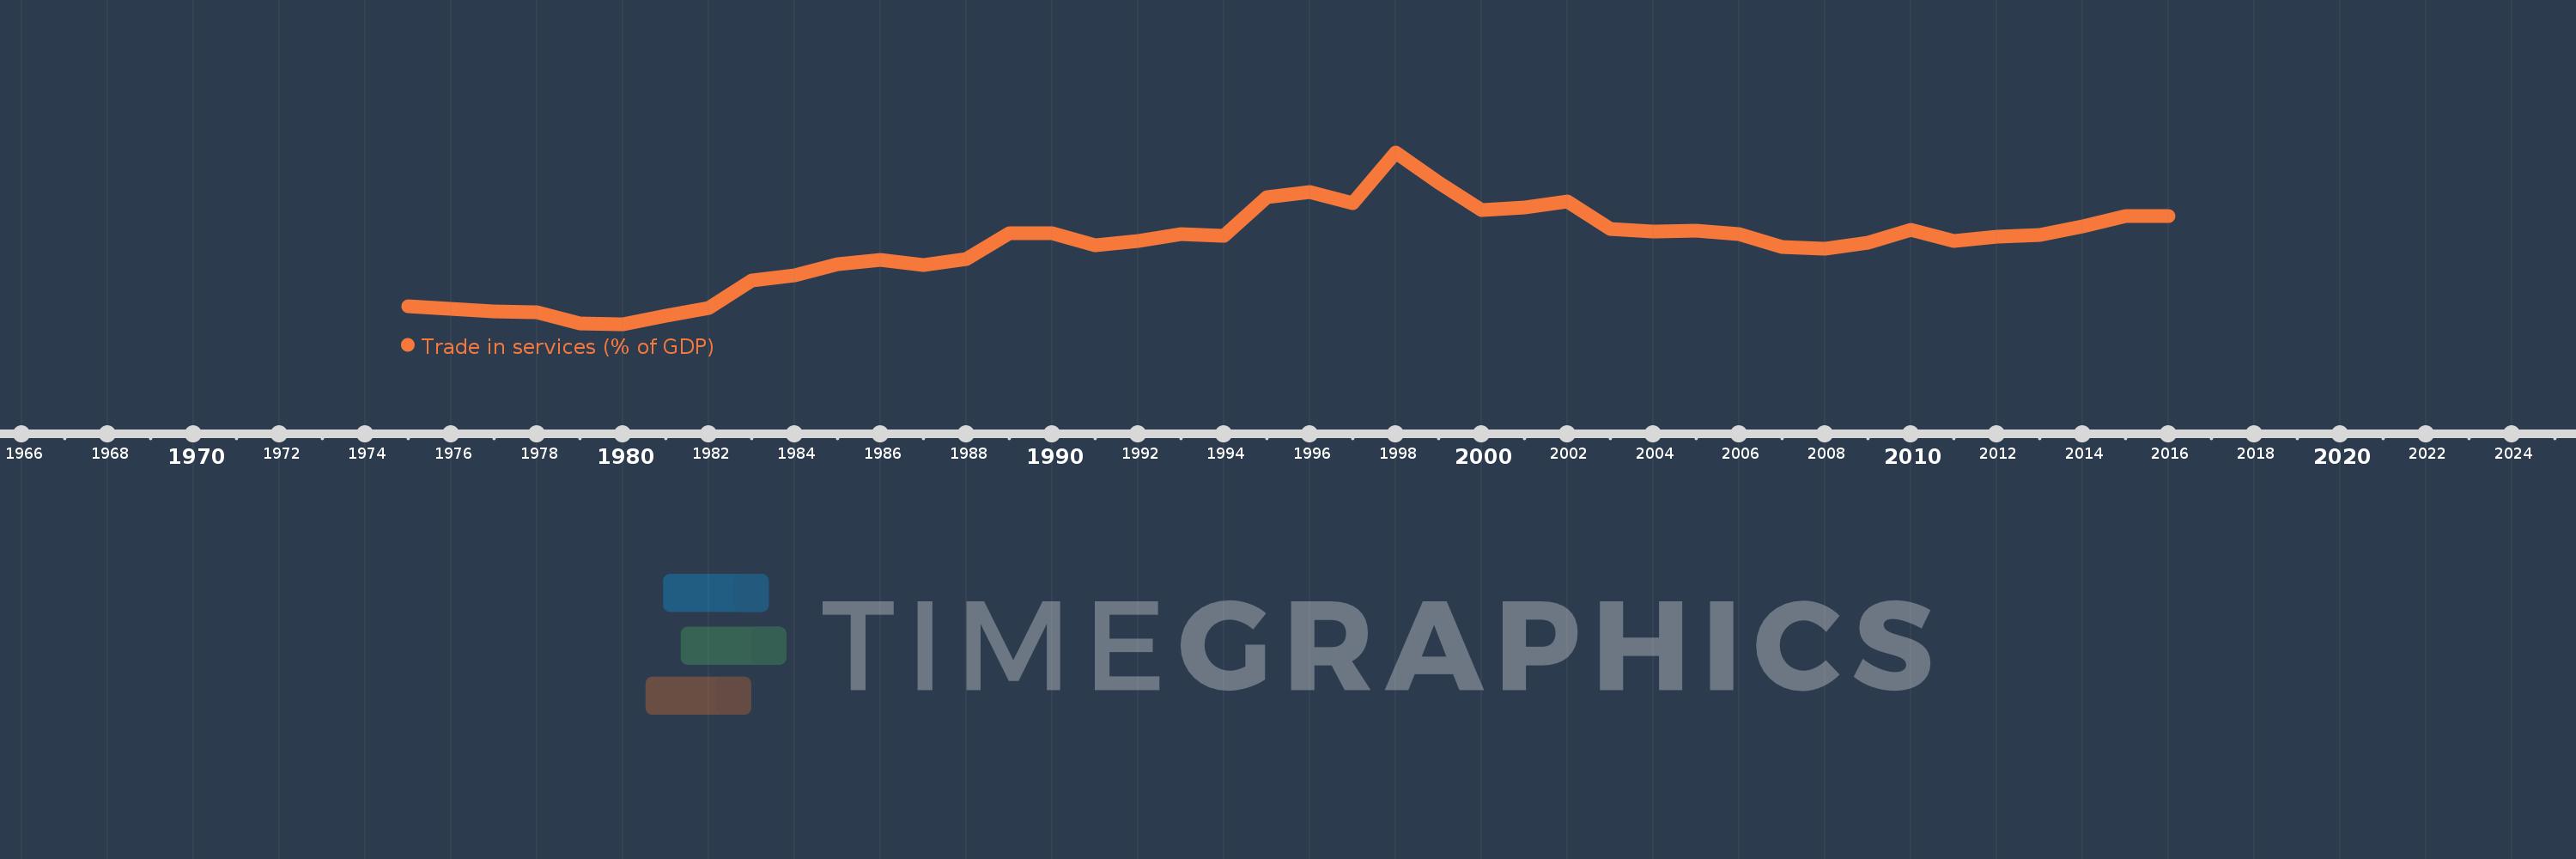
Trade in services (% of GDP)
2016,2015,2014,2013,2012,2011,2010,2009,2008,2007,2006,2005,2004,2003,2002,2001,2000,1999,1998,1997,1996,1995,1994,1993,1992,1991,1990,1989,1988,1987,1986,1985,1984,1983,1982,1981,1980,1979,1978,1977,1976,1975
This statistics in other country:
AfghanistanAlbaniaAlgeriaAngolaAntigua and BarbudaArab WorldArgentinaArmeniaArubaAustraliaAustriaAzerbaijanBahamas, TheBahrainBangladeshBarbadosBelarusBelgiumBelizeBeninBermudaBhutanBoliviaBosnia and HerzegovinaBotswanaBrazilBrunei DarussalamBulgariaBurkina FasoBurundiCabo VerdeCambodiaCameroonCanadaCaribbean small statesCentral African RepublicCentral Europe and the BalticsChadChileChinaColombiaComorosCongo, Dem. Rep.Congo, Rep.Costa RicaCote d'IvoireCroatiaCyprusCzech RepublicDenmarkDjiboutiDominicaDominican RepublicEarly-demographic dividendEast Asia & PacificEast Asia & Pacific (excluding high income)East Asia & Pacific (IDA & IBRD countries)EcuadorEgypt, Arab Rep.El SalvadorEquatorial GuineaEritreaEstoniaEthiopiaEuro areaEurope & Central AsiaEurope & Central Asia (excluding high income)Europe & Central Asia (IDA & IBRD countries)European UnionFaroe IslandsFijiFinlandFragile and conflict affected situationsFranceGabonGambia, TheGeorgiaGermanyGhanaGreeceGrenadaGuatemalaGuineaGuinea-BissauGuyanaHaitiHeavily indebted poor countries (HIPC)High incomeHondurasHong Kong SAR, ChinaHungaryIBRD onlyIcelandIDA & IBRD totalIDA blendIDA onlyIDA totalIndiaIndonesiaIran, Islamic Rep.IraqIrelandIsraelItalyJamaicaJapanJordanKazakhstanKenyaKiribatiKorea, Rep.KosovoKuwaitKyrgyz RepublicLao PDRLate-demographic dividendLatin America & Caribbean Latin America & Caribbean (excluding high income)Latin America & the Caribbean (IDA & IBRD countries)LatviaLeast developed countries: UN classificationLebanonLesothoLiberiaLibyaLithuaniaLow & middle incomeLow incomeLower middle incomeLuxembourgMacao SAR, ChinaMacedonia, FYRMadagascarMalawiMalaysiaMaldivesMaliMaltaMarshall IslandsMauritaniaMauritiusMexicoMicronesia, Fed. Sts.Middle East & North AfricaMiddle East & North Africa (excluding high income)Middle East & North Africa (IDA & IBRD countries)Middle incomeMoldovaMongoliaMontenegroMoroccoMozambiqueMyanmarNamibiaNepalNetherlandsNew ZealandNicaraguaNigerNigeriaNorth AmericaNorwayOECD membersOmanOther small statesPacific island small statesPakistanPalauPanamaPapua New GuineaParaguayPeruPhilippinesPolandPortugalPost-demographic dividendPre-demographic dividendQatarRomaniaRussian FederationRwandaSamoaSao Tome and PrincipeSaudi ArabiaSenegalSerbiaSeychellesSierra LeoneSingaporeSlovak RepublicSloveniaSmall statesSolomon IslandsSouth AfricaSouth AsiaSouth Asia (IDA & IBRD)South SudanSpainSri LankaSt. Kitts and NevisSt. LuciaSt. Vincent and the GrenadinesSub-Saharan Africa Sub-Saharan Africa (excluding high income)Sub-Saharan Africa (IDA & IBRD countries)SudanSurinameSwazilandSwedenSwitzerlandSyrian Arab RepublicTajikistanTanzaniaThailandTimor-LesteTogoTongaTrinidad and TobagoTunisiaTurkeyTuvaluUgandaUkraineUnited KingdomUnited StatesUpper middle incomeUruguayVanuatuVenezuela, RBVietnamWest Bank and GazaWorldYemen, Rep.ZambiaZimbabwe Timeline:
This timeline shows a graph from 1975 to 2016 of Turkey. No data until 1974. Number of actual observations by date: 42.
Source name:
World Development Indicators
Source organization:
International Monetary Fund, Balance of Payments Statistics Yearbook and data files, and World Bank and OECD GDP estimates.
Categories, topics:
Economy & Growth, Private Sector, Trade
Last updated:
apr 23, 2017
Indicators value changes by year
Maximum:
14.665
jan 1, 1998
At the date of observation
Value
Absolute change
Change from previous value
jan 1, 1975
2.57
+2.57
0.0%
jan 1, 1976
2.357
-0.213
-8.3%
jan 1, 1977
2.139
-0.218
-9.24%
jan 1, 1978
2.081
-0.058
-2.73%
jan 1, 1979
1.193
-0.888
-42.68%
jan 1, 1980
1.165
-0.028
-2.36%
jan 1, 1981
1.861
+0.696
59.79%
jan 1, 1982
2.438
+0.577
31.03%
jan 1, 1983
4.569
+2.131
87.4%
jan 1, 1984
5.034
+0.465
10.19%
jan 1, 1985
5.861
+0.827
16.42%
jan 1, 1986
6.242
+0.381
6.51%
jan 1, 1987
5.843
-0.399
-6.39%
jan 1, 1988
6.318
+0.475
8.13%
jan 1, 1989
8.34
+2.021
31.99%
jan 1, 1990
8.287
-0.053
-0.63%
jan 1, 1991
7.358
-0.929
-11.21%
jan 1, 1992
7.725
+0.367
4.99%
jan 1, 1993
8.224
+0.499
6.46%
jan 1, 1994
8.103
-0.121
-1.47%
jan 1, 1995
11.158
+3.055
37.7%
jan 1, 1996
11.582
+0.424
3.8%
jan 1, 1997
10.709
-0.873
-7.54%
jan 1, 1998
14.665
+3.956
36.94%
jan 1, 1999
12.3
-2.365
-16.12%
jan 1, 2000
10.128
-2.172
-17.66%
jan 1, 2001
10.347
+0.219
2.16%
jan 1, 2002
10.842
+0.495
4.78%
jan 1, 2003
8.683
-2.159
-19.91%
jan 1, 2004
8.47
-0.213
-2.45%
jan 1, 2005
8.526
+0.056
0.66%
jan 1, 2006
8.235
-0.292
-3.42%
jan 1, 2007
7.21
-1.025
-12.45%
jan 1, 2008
7.096
-0.114
-1.58%
jan 1, 2009
7.573
+0.478
6.73%
jan 1, 2010
8.608
+1.035
13.66%
jan 1, 2011
7.681
-0.927
-10.77%
jan 1, 2012
8.032
+0.351
4.57%
jan 1, 2013
8.182
+0.15
1.87%
jan 1, 2014
8.833
+0.651
7.95%
jan 1, 2015
9.633
+0.8
9.06%
jan 1, 2016
9.647
+0.015
0.15%
Ranking of countries by current statistics by years


Comments: