29
/
en
AIzaSyAYiBZKx7MnpbEhh9jyipgxe19OcubqV5w
April 1, 2024
208535
Netherlands
NLD
true
2
1
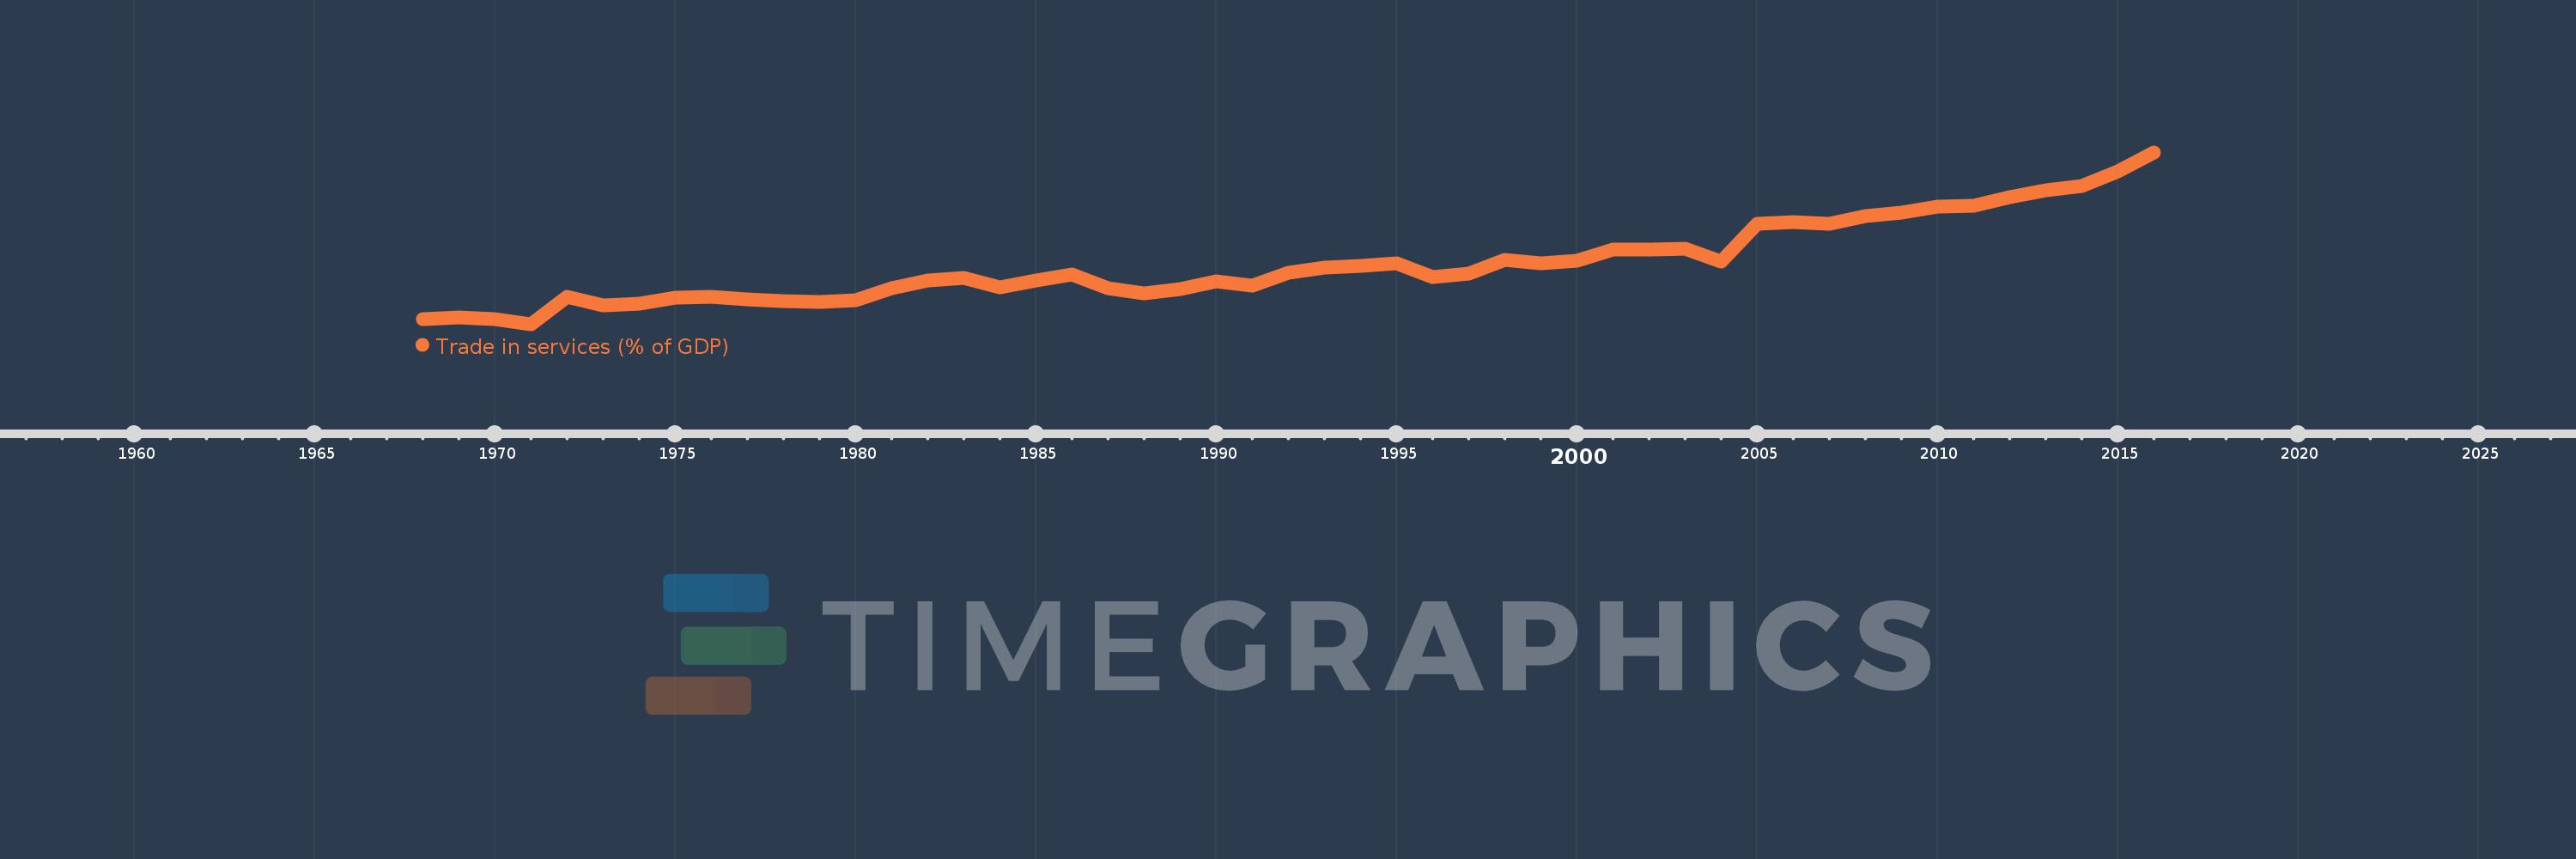
Trade in services (% of GDP)
2016,2015,2014,2013,2012,2011,2010,2009,2008,2007,2006,2005,2004,2003,2002,2001,2000,1999,1998,1997,1996,1995,1994,1993,1992,1991,1990,1989,1988,1987,1986,1985,1984,1983,1982,1981,1980,1979,1978,1977,1976,1975,1974,1973,1972,1971,1970,1969,1968
This statistics in other country:
AfghanistanAlbaniaAlgeriaAngolaAntigua and BarbudaArab WorldArgentinaArmeniaArubaAustraliaAustriaAzerbaijanBahamas, TheBahrainBangladeshBarbadosBelarusBelgiumBelizeBeninBermudaBhutanBoliviaBosnia and HerzegovinaBotswanaBrazilBrunei DarussalamBulgariaBurkina FasoBurundiCabo VerdeCambodiaCameroonCanadaCaribbean small statesCentral African RepublicCentral Europe and the BalticsChadChileChinaColombiaComorosCongo, Dem. Rep.Congo, Rep.Costa RicaCote d'IvoireCroatiaCyprusCzech RepublicDenmarkDjiboutiDominicaDominican RepublicEarly-demographic dividendEast Asia & PacificEast Asia & Pacific (excluding high income)East Asia & Pacific (IDA & IBRD countries)EcuadorEgypt, Arab Rep.El SalvadorEquatorial GuineaEritreaEstoniaEthiopiaEuro areaEurope & Central AsiaEurope & Central Asia (excluding high income)Europe & Central Asia (IDA & IBRD countries)European UnionFaroe IslandsFijiFinlandFragile and conflict affected situationsFranceGabonGambia, TheGeorgiaGermanyGhanaGreeceGrenadaGuatemalaGuineaGuinea-BissauGuyanaHaitiHeavily indebted poor countries (HIPC)High incomeHondurasHong Kong SAR, ChinaHungaryIBRD onlyIcelandIDA & IBRD totalIDA blendIDA onlyIDA totalIndiaIndonesiaIran, Islamic Rep.IraqIrelandIsraelItalyJamaicaJapanJordanKazakhstanKenyaKiribatiKorea, Rep.KosovoKuwaitKyrgyz RepublicLao PDRLate-demographic dividendLatin America & Caribbean Latin America & Caribbean (excluding high income)Latin America & the Caribbean (IDA & IBRD countries)LatviaLeast developed countries: UN classificationLebanonLesothoLiberiaLibyaLithuaniaLow & middle incomeLow incomeLower middle incomeLuxembourgMacao SAR, ChinaMacedonia, FYRMadagascarMalawiMalaysiaMaldivesMaliMaltaMarshall IslandsMauritaniaMauritiusMexicoMicronesia, Fed. Sts.Middle East & North AfricaMiddle East & North Africa (excluding high income)Middle East & North Africa (IDA & IBRD countries)Middle incomeMoldovaMongoliaMontenegroMoroccoMozambiqueMyanmarNamibiaNepalNetherlandsNew ZealandNicaraguaNigerNigeriaNorth AmericaNorwayOECD membersOmanOther small statesPacific island small statesPakistanPalauPanamaPapua New GuineaParaguayPeruPhilippinesPolandPortugalPost-demographic dividendPre-demographic dividendQatarRomaniaRussian FederationRwandaSamoaSao Tome and PrincipeSaudi ArabiaSenegalSerbiaSeychellesSierra LeoneSingaporeSlovak RepublicSloveniaSmall statesSolomon IslandsSouth AfricaSouth AsiaSouth Asia (IDA & IBRD)South SudanSpainSri LankaSt. Kitts and NevisSt. LuciaSt. Vincent and the GrenadinesSub-Saharan Africa Sub-Saharan Africa (excluding high income)Sub-Saharan Africa (IDA & IBRD countries)SudanSurinameSwazilandSwedenSwitzerlandSyrian Arab RepublicTajikistanTanzaniaThailandTimor-LesteTogoTongaTrinidad and TobagoTunisiaTurkeyTuvaluUgandaUkraineUnited KingdomUnited StatesUpper middle incomeUruguayVanuatuVenezuela, RBVietnamWest Bank and GazaWorldYemen, Rep.ZambiaZimbabwe Timeline:
This timeline shows a graph from 1968 to 2016 of Netherlands. No data until 1967. Number of actual observations by date: 49.
Source name:
World Development Indicators
Source organization:
International Monetary Fund, Balance of Payments Statistics Yearbook and data files, and World Bank and OECD GDP estimates.
Categories, topics:
Economy & Growth, Private Sector, Trade
Last updated:
apr 23, 2017
Indicators value changes by year
Minimum:
13.262
jan 1, 1971
Maximum:
39.032
jan 1, 2016
At the date of observation
Value
Absolute change
Change from previous value
jan 1, 1968
14.039
+14.039
0.0%
jan 1, 1969
14.285
+0.246
1.75%
jan 1, 1970
14.012
-0.273
-1.91%
jan 1, 1971
13.262
-0.75
-5.35%
jan 1, 1972
17.376
+4.114
31.02%
jan 1, 1973
16.078
-1.298
-7.47%
jan 1, 1974
16.347
+0.268
1.67%
jan 1, 1975
17.219
+0.872
5.34%
jan 1, 1976
17.372
+0.153
0.89%
jan 1, 1977
17.037
-0.335
-1.93%
jan 1, 1978
16.719
-0.318
-1.87%
jan 1, 1979
16.659
-0.059
-0.36%
jan 1, 1980
16.898
+0.239
1.44%
jan 1, 1981
18.685
+1.786
10.57%
jan 1, 1982
19.859
+1.175
6.29%
jan 1, 1983
20.213
+0.354
1.78%
jan 1, 1984
18.754
-1.459
-7.22%
jan 1, 1985
19.824
+1.07
5.7%
jan 1, 1986
20.719
+0.895
4.52%
jan 1, 1987
18.659
-2.06
-9.94%
jan 1, 1988
17.887
-0.772
-4.14%
jan 1, 1989
18.566
+0.68
3.8%
jan 1, 1990
19.679
+1.113
5.99%
jan 1, 1991
19.104
-0.575
-2.92%
jan 1, 1992
20.991
+1.887
9.88%
jan 1, 1993
21.71
+0.719
3.42%
jan 1, 1994
22.024
+0.314
1.45%
jan 1, 1995
22.424
+0.4
1.82%
jan 1, 1996
20.394
-2.03
-9.05%
jan 1, 1997
20.842
+0.448
2.2%
jan 1, 1998
22.872
+2.03
9.74%
jan 1, 1999
22.379
-0.493
-2.16%
jan 1, 2000
22.779
+0.4
1.79%
jan 1, 2001
24.459
+1.679
7.37%
jan 1, 2002
24.486
+0.027
0.11%
jan 1, 2003
24.565
+0.079
0.32%
jan 1, 2004
22.686
-1.879
-7.65%
jan 1, 2005
28.274
+5.588
24.63%
jan 1, 2006
28.583
+0.309
1.09%
jan 1, 2007
28.288
-0.295
-1.03%
jan 1, 2008
29.466
+1.178
4.17%
jan 1, 2009
29.984
+0.517
1.76%
jan 1, 2010
30.864
+0.88
2.94%
jan 1, 2011
30.99
+0.126
0.41%
jan 1, 2012
32.256
+1.266
4.09%
jan 1, 2013
33.405
+1.149
3.56%
jan 1, 2014
33.939
+0.534
1.6%
jan 1, 2015
36.134
+2.194
6.47%
jan 1, 2016
39.032
+2.899
8.02%
Ranking of countries by current statistics by years


Comments: