29
/
en
AIzaSyAYiBZKx7MnpbEhh9jyipgxe19OcubqV5w
April 1, 2024
273070
Uganda
UGA
true
2
1
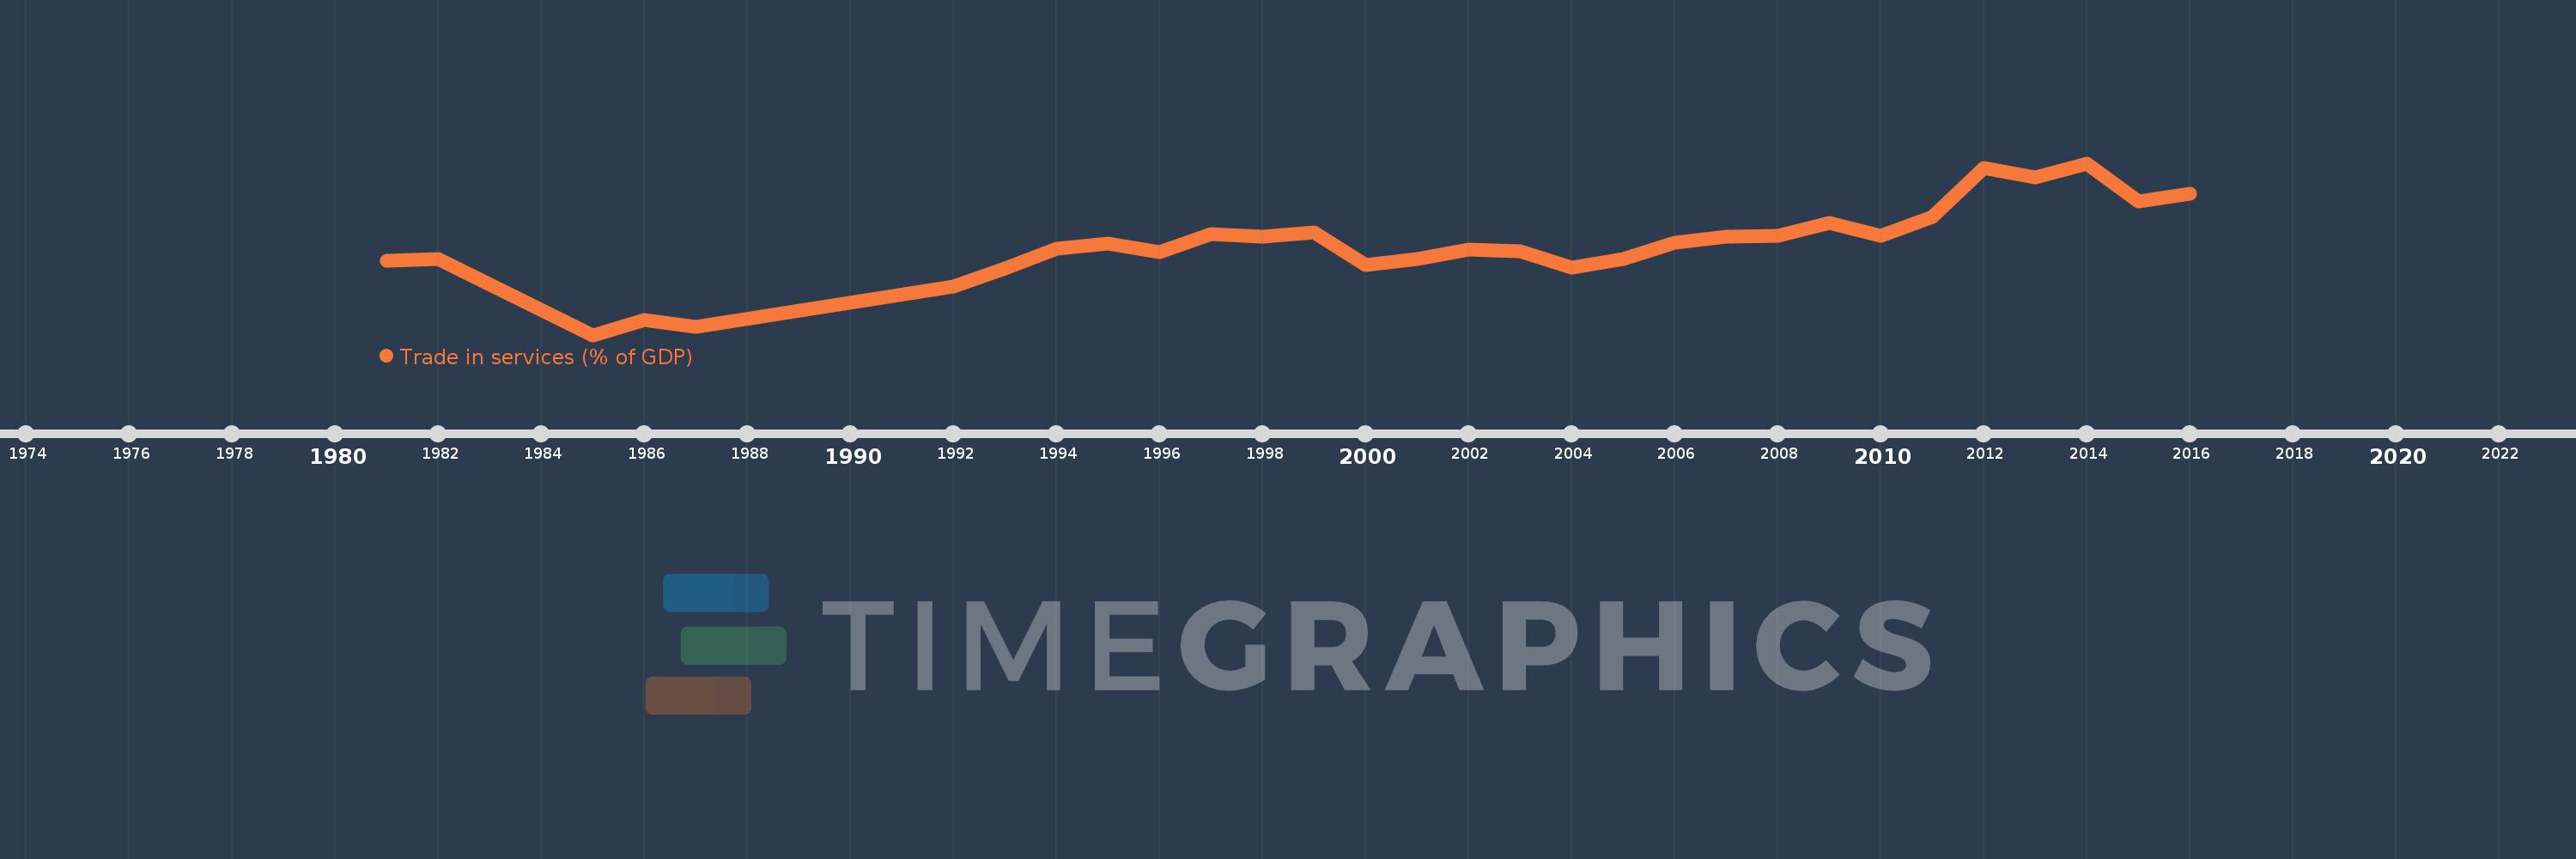
Trade in services (% of GDP)
2016,2015,2014,2013,2012,2011,2010,2009,2008,2007,2006,2005,2004,2003,2002,2001,2000,1999,1998,1997,1996,1995,1994,1993,1992,1987,1986,1985,1982,1981
This statistics in other country:
AfghanistanAlbaniaAlgeriaAngolaAntigua and BarbudaArab WorldArgentinaArmeniaArubaAustraliaAustriaAzerbaijanBahamas, TheBahrainBangladeshBarbadosBelarusBelgiumBelizeBeninBermudaBhutanBoliviaBosnia and HerzegovinaBotswanaBrazilBrunei DarussalamBulgariaBurkina FasoBurundiCabo VerdeCambodiaCameroonCanadaCaribbean small statesCentral African RepublicCentral Europe and the BalticsChadChileChinaColombiaComorosCongo, Dem. Rep.Congo, Rep.Costa RicaCote d'IvoireCroatiaCyprusCzech RepublicDenmarkDjiboutiDominicaDominican RepublicEarly-demographic dividendEast Asia & PacificEast Asia & Pacific (excluding high income)East Asia & Pacific (IDA & IBRD countries)EcuadorEgypt, Arab Rep.El SalvadorEquatorial GuineaEritreaEstoniaEthiopiaEuro areaEurope & Central AsiaEurope & Central Asia (excluding high income)Europe & Central Asia (IDA & IBRD countries)European UnionFaroe IslandsFijiFinlandFragile and conflict affected situationsFranceGabonGambia, TheGeorgiaGermanyGhanaGreeceGrenadaGuatemalaGuineaGuinea-BissauGuyanaHaitiHeavily indebted poor countries (HIPC)High incomeHondurasHong Kong SAR, ChinaHungaryIBRD onlyIcelandIDA & IBRD totalIDA blendIDA onlyIDA totalIndiaIndonesiaIran, Islamic Rep.IraqIrelandIsraelItalyJamaicaJapanJordanKazakhstanKenyaKiribatiKorea, Rep.KosovoKuwaitKyrgyz RepublicLao PDRLate-demographic dividendLatin America & Caribbean Latin America & Caribbean (excluding high income)Latin America & the Caribbean (IDA & IBRD countries)LatviaLeast developed countries: UN classificationLebanonLesothoLiberiaLibyaLithuaniaLow & middle incomeLow incomeLower middle incomeLuxembourgMacao SAR, ChinaMacedonia, FYRMadagascarMalawiMalaysiaMaldivesMaliMaltaMarshall IslandsMauritaniaMauritiusMexicoMicronesia, Fed. Sts.Middle East & North AfricaMiddle East & North Africa (excluding high income)Middle East & North Africa (IDA & IBRD countries)Middle incomeMoldovaMongoliaMontenegroMoroccoMozambiqueMyanmarNamibiaNepalNetherlandsNew ZealandNicaraguaNigerNigeriaNorth AmericaNorwayOECD membersOmanOther small statesPacific island small statesPakistanPalauPanamaPapua New GuineaParaguayPeruPhilippinesPolandPortugalPost-demographic dividendPre-demographic dividendQatarRomaniaRussian FederationRwandaSamoaSao Tome and PrincipeSaudi ArabiaSenegalSerbiaSeychellesSierra LeoneSingaporeSlovak RepublicSloveniaSmall statesSolomon IslandsSouth AfricaSouth AsiaSouth Asia (IDA & IBRD)South SudanSpainSri LankaSt. Kitts and NevisSt. LuciaSt. Vincent and the GrenadinesSub-Saharan Africa Sub-Saharan Africa (excluding high income)Sub-Saharan Africa (IDA & IBRD countries)SudanSurinameSwazilandSwedenSwitzerlandSyrian Arab RepublicTajikistanTanzaniaThailandTimor-LesteTogoTongaTrinidad and TobagoTunisiaTurkeyTuvaluUgandaUkraineUnited KingdomUnited StatesUpper middle incomeUruguayVanuatuVenezuela, RBVietnamWest Bank and GazaWorldYemen, Rep.ZambiaZimbabwe Timeline:
This timeline shows a graph from 1981 to 2016 of Uganda. No data until 1980. Number of actual observations by date: 30.
Source name:
World Development Indicators
Source organization:
International Monetary Fund, Balance of Payments Statistics Yearbook and data files, and World Bank and OECD GDP estimates.
Categories, topics:
Economy & Growth, Private Sector, Trade
Last updated:
apr 23, 2017
Indicators value changes by year
Maximum:
21.098
jan 1, 2014
At the date of observation
Value
Absolute change
Change from previous value
jan 1, 1981
10.71
+10.71
0.0%
jan 1, 1982
10.82
+0.11
1.03%
jan 1, 1985
2.741
-8.079
-74.67%
jan 1, 1986
4.347
+1.606
58.6%
jan 1, 1987
3.627
-0.72
-16.56%
jan 1, 1992
7.906
+4.278
117.96%
jan 1, 1993
9.876
+1.97
24.92%
jan 1, 1994
12.009
+2.133
21.59%
jan 1, 1995
12.54
+0.531
4.43%
jan 1, 1996
11.583
-0.957
-7.63%
jan 1, 1997
13.554
+1.971
17.02%
jan 1, 1998
13.295
-0.26
-1.92%
jan 1, 1999
13.734
+0.44
3.31%
jan 1, 2000
10.256
-3.479
-25.33%
jan 1, 2001
10.851
+0.595
5.8%
jan 1, 2002
11.865
+1.014
9.35%
jan 1, 2003
11.649
-0.216
-1.82%
jan 1, 2004
9.91
-1.739
-14.93%
jan 1, 2005
10.865
+0.955
9.63%
jan 1, 2006
12.592
+1.727
15.89%
jan 1, 2007
13.26
+0.669
5.31%
jan 1, 2008
13.342
+0.082
0.62%
jan 1, 2009
14.674
+1.332
9.99%
jan 1, 2010
13.326
-1.348
-9.19%
jan 1, 2011
15.388
+2.062
15.47%
jan 1, 2012
20.581
+5.193
33.74%
jan 1, 2013
19.583
-0.998
-4.85%
jan 1, 2014
21.098
+1.515
7.74%
jan 1, 2015
16.976
-4.121
-19.53%
jan 1, 2016
17.832
+0.856
5.04%
Ranking of countries by current statistics by years


Comments: