29
/
en
AIzaSyAYiBZKx7MnpbEhh9jyipgxe19OcubqV5w
April 1, 2024
156831
Indonesia
IDN
true
2
1
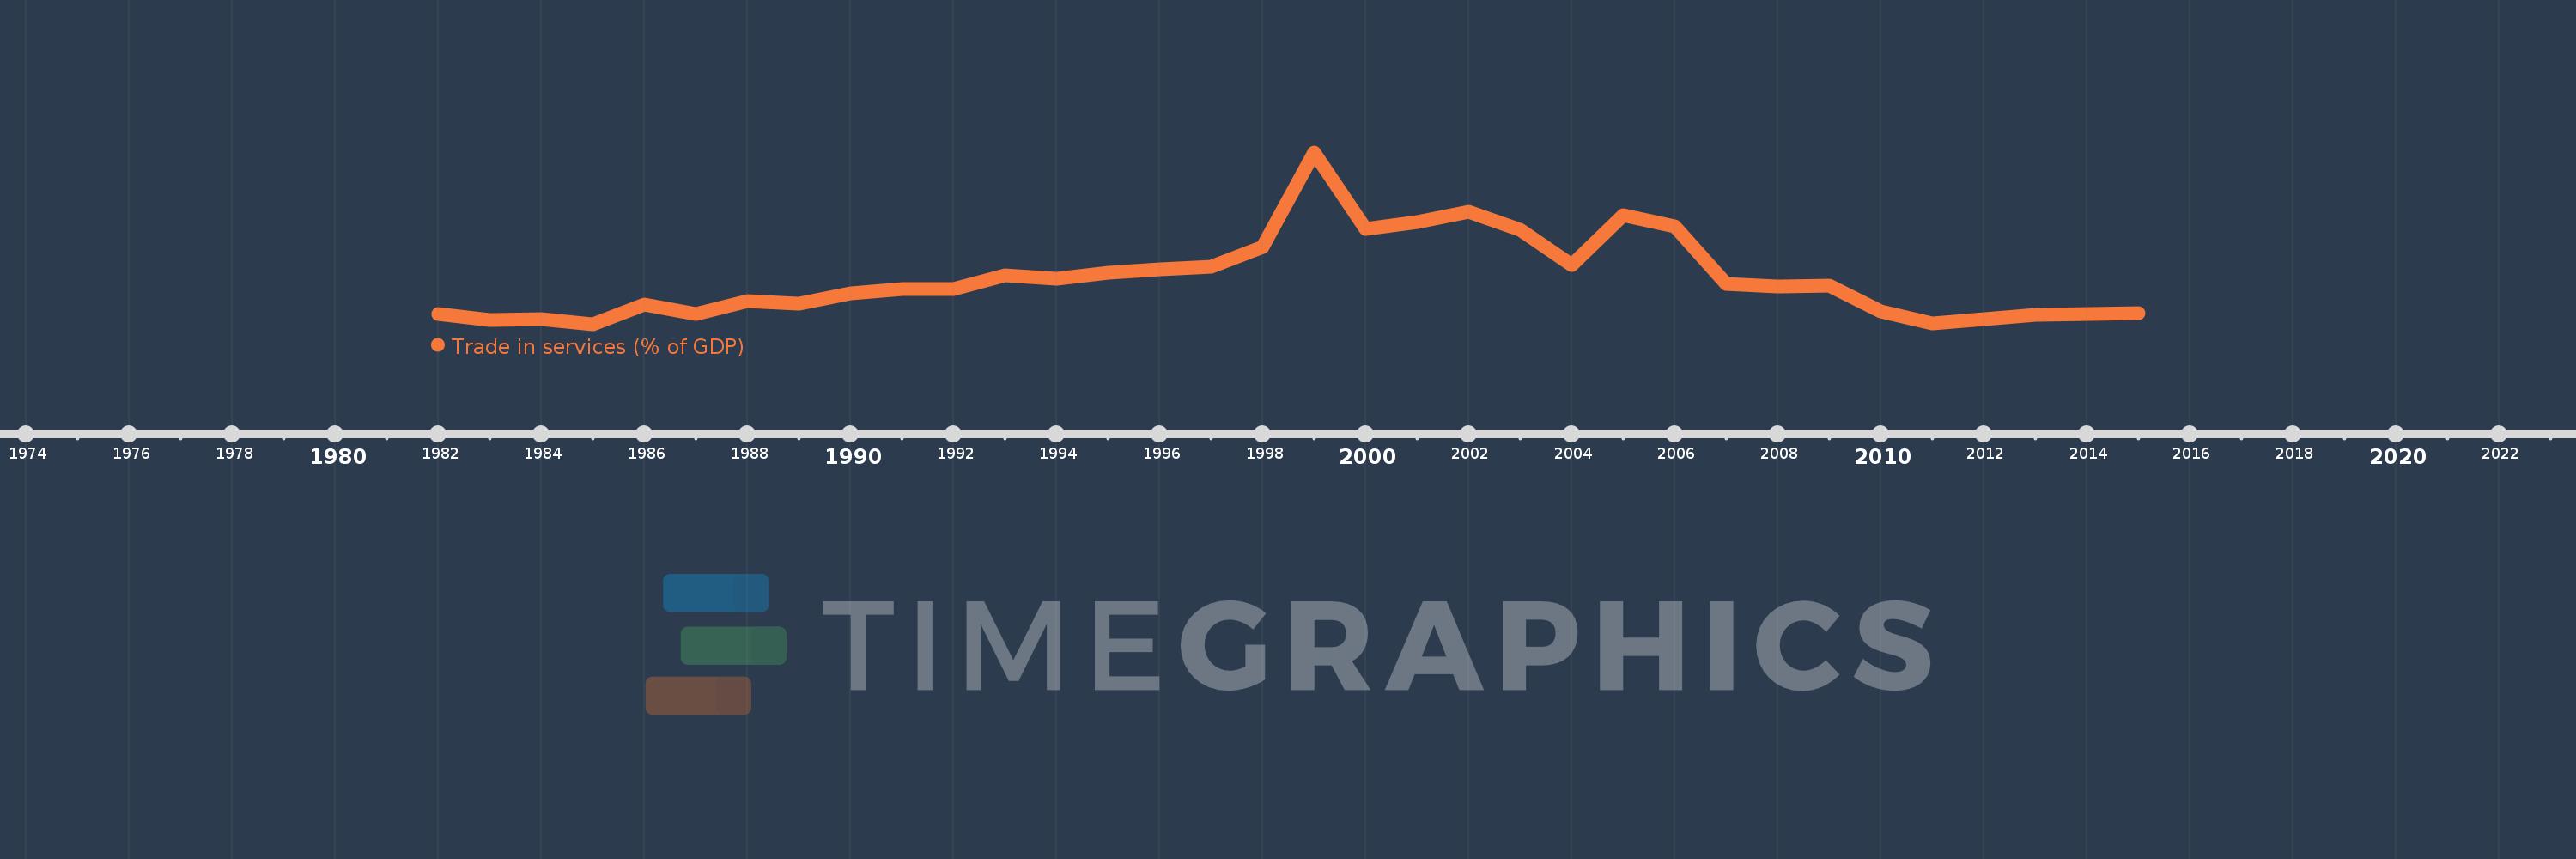
Trade in services (% of GDP)
2015,2014,2013,2012,2011,2010,2009,2008,2007,2006,2005,2004,2003,2002,2001,2000,1999,1998,1997,1996,1995,1994,1993,1992,1991,1990,1989,1988,1987,1986,1985,1984,1983,1982
This statistics in other country:
AfghanistanAlbaniaAlgeriaAngolaAntigua and BarbudaArab WorldArgentinaArmeniaArubaAustraliaAustriaAzerbaijanBahamas, TheBahrainBangladeshBarbadosBelarusBelgiumBelizeBeninBermudaBhutanBoliviaBosnia and HerzegovinaBotswanaBrazilBrunei DarussalamBulgariaBurkina FasoBurundiCabo VerdeCambodiaCameroonCanadaCaribbean small statesCentral African RepublicCentral Europe and the BalticsChadChileChinaColombiaComorosCongo, Dem. Rep.Congo, Rep.Costa RicaCote d'IvoireCroatiaCyprusCzech RepublicDenmarkDjiboutiDominicaDominican RepublicEarly-demographic dividendEast Asia & PacificEast Asia & Pacific (excluding high income)East Asia & Pacific (IDA & IBRD countries)EcuadorEgypt, Arab Rep.El SalvadorEquatorial GuineaEritreaEstoniaEthiopiaEuro areaEurope & Central AsiaEurope & Central Asia (excluding high income)Europe & Central Asia (IDA & IBRD countries)European UnionFaroe IslandsFijiFinlandFragile and conflict affected situationsFranceGabonGambia, TheGeorgiaGermanyGhanaGreeceGrenadaGuatemalaGuineaGuinea-BissauGuyanaHaitiHeavily indebted poor countries (HIPC)High incomeHondurasHong Kong SAR, ChinaHungaryIBRD onlyIcelandIDA & IBRD totalIDA blendIDA onlyIDA totalIndiaIndonesiaIran, Islamic Rep.IraqIrelandIsraelItalyJamaicaJapanJordanKazakhstanKenyaKiribatiKorea, Rep.KosovoKuwaitKyrgyz RepublicLao PDRLate-demographic dividendLatin America & Caribbean Latin America & Caribbean (excluding high income)Latin America & the Caribbean (IDA & IBRD countries)LatviaLeast developed countries: UN classificationLebanonLesothoLiberiaLibyaLithuaniaLow & middle incomeLow incomeLower middle incomeLuxembourgMacao SAR, ChinaMacedonia, FYRMadagascarMalawiMalaysiaMaldivesMaliMaltaMarshall IslandsMauritaniaMauritiusMexicoMicronesia, Fed. Sts.Middle East & North AfricaMiddle East & North Africa (excluding high income)Middle East & North Africa (IDA & IBRD countries)Middle incomeMoldovaMongoliaMontenegroMoroccoMozambiqueMyanmarNamibiaNepalNetherlandsNew ZealandNicaraguaNigerNigeriaNorth AmericaNorwayOECD membersOmanOther small statesPacific island small statesPakistanPalauPanamaPapua New GuineaParaguayPeruPhilippinesPolandPortugalPost-demographic dividendPre-demographic dividendQatarRomaniaRussian FederationRwandaSamoaSao Tome and PrincipeSaudi ArabiaSenegalSerbiaSeychellesSierra LeoneSingaporeSlovak RepublicSloveniaSmall statesSolomon IslandsSouth AfricaSouth AsiaSouth Asia (IDA & IBRD)South SudanSpainSri LankaSt. Kitts and NevisSt. LuciaSt. Vincent and the GrenadinesSub-Saharan Africa Sub-Saharan Africa (excluding high income)Sub-Saharan Africa (IDA & IBRD countries)SudanSurinameSwazilandSwedenSwitzerlandSyrian Arab RepublicTajikistanTanzaniaThailandTimor-LesteTogoTongaTrinidad and TobagoTunisiaTurkeyTuvaluUgandaUkraineUnited KingdomUnited StatesUpper middle incomeUruguayVanuatuVenezuela, RBVietnamWest Bank and GazaWorldYemen, Rep.ZambiaZimbabwe Timeline:
This timeline shows a graph from 1982 to 2015 of Indonesia. No data until 1981. Number of actual observations by date: 34.
Source name:
World Development Indicators
Source organization:
International Monetary Fund, Balance of Payments Statistics Yearbook and data files, and World Bank and OECD GDP estimates.
Categories, topics:
Economy & Growth, Private Sector, Trade
Last updated:
apr 23, 2017
Indicators value changes by year
Maximum:
17.358
jan 1, 1999
At the date of observation
Value
Absolute change
Change from previous value
jan 1, 1982
6.369
+6.369
0.0%
jan 1, 1983
5.952
-0.418
-6.56%
jan 1, 1984
5.992
+0.041
0.68%
jan 1, 1985
5.667
-0.325
-5.42%
jan 1, 1986
7.01
+1.343
23.69%
jan 1, 1987
6.379
-0.632
-9.01%
jan 1, 1988
7.25
+0.871
13.66%
jan 1, 1989
7.088
-0.162
-2.24%
jan 1, 1990
7.744
+0.656
9.25%
jan 1, 1991
8.05
+0.306
3.95%
jan 1, 1992
8.048
-0.001
-0.02%
jan 1, 1993
8.975
+0.927
11.52%
jan 1, 1994
8.737
-0.238
-2.66%
jan 1, 1995
9.165
+0.429
4.9%
jan 1, 1996
9.404
+0.239
2.61%
jan 1, 1997
9.561
+0.156
1.66%
jan 1, 1998
10.915
+1.354
14.16%
jan 1, 1999
17.358
+6.443
59.03%
jan 1, 2000
12.125
-5.233
-30.15%
jan 1, 2001
12.635
+0.511
4.21%
jan 1, 2002
13.326
+0.69
5.46%
jan 1, 2003
12.117
-1.209
-9.07%
jan 1, 2004
9.666
-2.451
-20.23%
jan 1, 2005
13.077
+3.411
35.28%
jan 1, 2006
12.311
-0.765
-5.85%
jan 1, 2007
8.424
-3.888
-31.58%
jan 1, 2008
8.223
-0.2
-2.38%
jan 1, 2009
8.293
+0.07
0.85%
jan 1, 2010
6.525
-1.768
-21.32%
jan 1, 2011
5.712
-0.813
-12.46%
jan 1, 2012
6.0
+0.288
5.04%
jan 1, 2013
6.306
+0.306
5.1%
jan 1, 2014
6.351
+0.045
0.71%
jan 1, 2015
6.409
+0.058
0.91%
Ranking of countries by current statistics by years


Comments: