29
/
en
AIzaSyAYiBZKx7MnpbEhh9jyipgxe19OcubqV5w
April 1, 2024
256922
Sweden
SWE
true
2
1
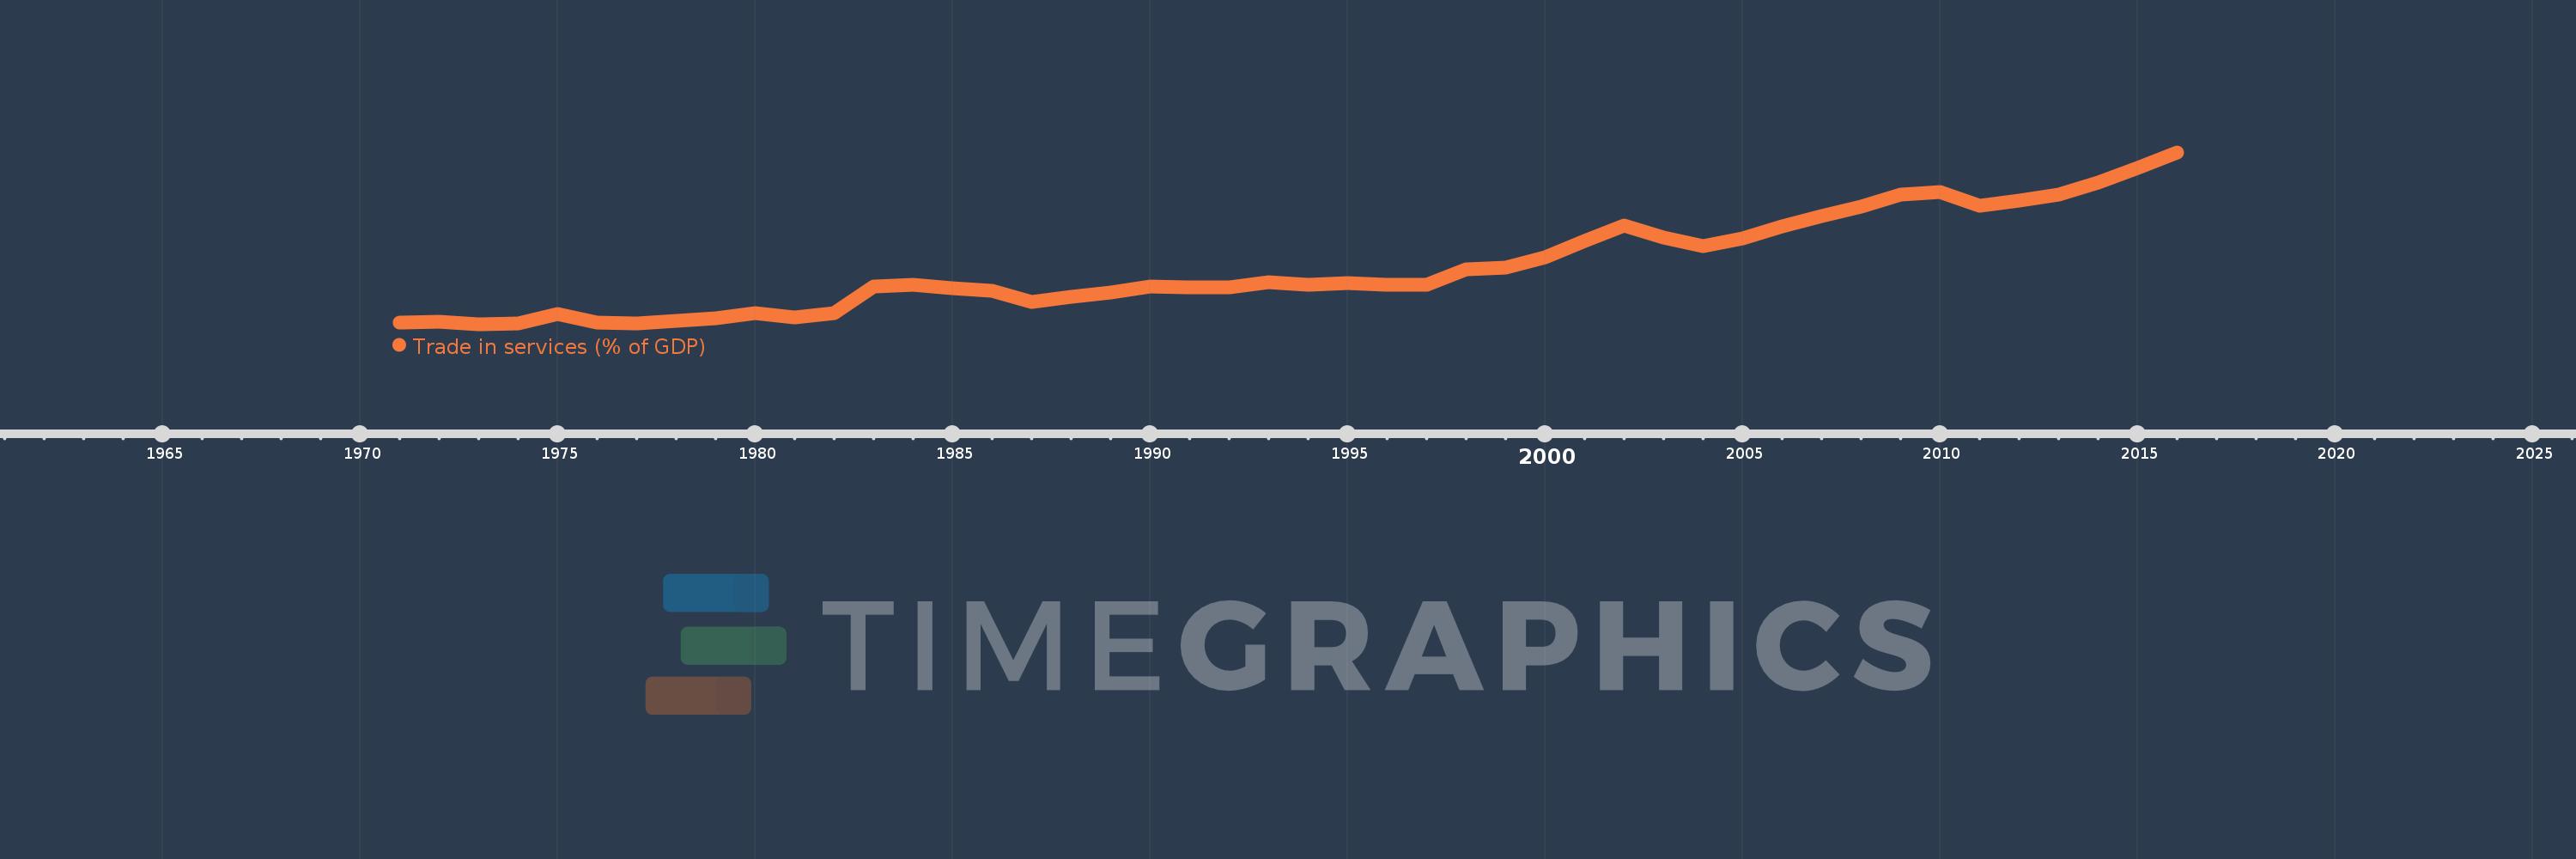
Trade in services (% of GDP)
2016,2015,2014,2013,2012,2011,2010,2009,2008,2007,2006,2005,2004,2003,2002,2001,2000,1999,1998,1997,1996,1995,1994,1993,1992,1991,1990,1989,1988,1987,1986,1985,1984,1983,1982,1981,1980,1979,1978,1977,1976,1975,1974,1973,1972,1971
This statistics in other country:
AfghanistanAlbaniaAlgeriaAngolaAntigua and BarbudaArab WorldArgentinaArmeniaArubaAustraliaAustriaAzerbaijanBahamas, TheBahrainBangladeshBarbadosBelarusBelgiumBelizeBeninBermudaBhutanBoliviaBosnia and HerzegovinaBotswanaBrazilBrunei DarussalamBulgariaBurkina FasoBurundiCabo VerdeCambodiaCameroonCanadaCaribbean small statesCentral African RepublicCentral Europe and the BalticsChadChileChinaColombiaComorosCongo, Dem. Rep.Congo, Rep.Costa RicaCote d'IvoireCroatiaCyprusCzech RepublicDenmarkDjiboutiDominicaDominican RepublicEarly-demographic dividendEast Asia & PacificEast Asia & Pacific (excluding high income)East Asia & Pacific (IDA & IBRD countries)EcuadorEgypt, Arab Rep.El SalvadorEquatorial GuineaEritreaEstoniaEthiopiaEuro areaEurope & Central AsiaEurope & Central Asia (excluding high income)Europe & Central Asia (IDA & IBRD countries)European UnionFaroe IslandsFijiFinlandFragile and conflict affected situationsFranceGabonGambia, TheGeorgiaGermanyGhanaGreeceGrenadaGuatemalaGuineaGuinea-BissauGuyanaHaitiHeavily indebted poor countries (HIPC)High incomeHondurasHong Kong SAR, ChinaHungaryIBRD onlyIcelandIDA & IBRD totalIDA blendIDA onlyIDA totalIndiaIndonesiaIran, Islamic Rep.IraqIrelandIsraelItalyJamaicaJapanJordanKazakhstanKenyaKiribatiKorea, Rep.KosovoKuwaitKyrgyz RepublicLao PDRLate-demographic dividendLatin America & Caribbean Latin America & Caribbean (excluding high income)Latin America & the Caribbean (IDA & IBRD countries)LatviaLeast developed countries: UN classificationLebanonLesothoLiberiaLibyaLithuaniaLow & middle incomeLow incomeLower middle incomeLuxembourgMacao SAR, ChinaMacedonia, FYRMadagascarMalawiMalaysiaMaldivesMaliMaltaMarshall IslandsMauritaniaMauritiusMexicoMicronesia, Fed. Sts.Middle East & North AfricaMiddle East & North Africa (excluding high income)Middle East & North Africa (IDA & IBRD countries)Middle incomeMoldovaMongoliaMontenegroMoroccoMozambiqueMyanmarNamibiaNepalNetherlandsNew ZealandNicaraguaNigerNigeriaNorth AmericaNorwayOECD membersOmanOther small statesPacific island small statesPakistanPalauPanamaPapua New GuineaParaguayPeruPhilippinesPolandPortugalPost-demographic dividendPre-demographic dividendQatarRomaniaRussian FederationRwandaSamoaSao Tome and PrincipeSaudi ArabiaSenegalSerbiaSeychellesSierra LeoneSingaporeSlovak RepublicSloveniaSmall statesSolomon IslandsSouth AfricaSouth AsiaSouth Asia (IDA & IBRD)South SudanSpainSri LankaSt. Kitts and NevisSt. LuciaSt. Vincent and the GrenadinesSub-Saharan Africa Sub-Saharan Africa (excluding high income)Sub-Saharan Africa (IDA & IBRD countries)SudanSurinameSwazilandSwedenSwitzerlandSyrian Arab RepublicTajikistanTanzaniaThailandTimor-LesteTogoTongaTrinidad and TobagoTunisiaTurkeyTuvaluUgandaUkraineUnited KingdomUnited StatesUpper middle incomeUruguayVanuatuVenezuela, RBVietnamWest Bank and GazaWorldYemen, Rep.ZambiaZimbabwe Timeline:
This timeline shows a graph from 1971 to 2016 of Sweden. No data until 1970. Number of actual observations by date: 46.
Source name:
World Development Indicators
Source organization:
International Monetary Fund, Balance of Payments Statistics Yearbook and data files, and World Bank and OECD GDP estimates.
Categories, topics:
Economy & Growth, Private Sector, Trade
Last updated:
apr 23, 2017
Indicators value changes by year
Maximum:
26.609
jan 1, 2016
At the date of observation
Value
Absolute change
Change from previous value
jan 1, 1971
7.921
+7.921
0.0%
jan 1, 1972
8.002
+0.081
1.02%
jan 1, 1973
7.748
-0.254
-3.17%
jan 1, 1974
7.843
+0.094
1.22%
jan 1, 1975
8.888
+1.045
13.33%
jan 1, 1976
7.971
-0.917
-10.32%
jan 1, 1977
7.854
-0.117
-1.47%
jan 1, 1978
8.116
+0.262
3.34%
jan 1, 1979
8.437
+0.321
3.95%
jan 1, 1980
8.995
+0.557
6.61%
jan 1, 1981
8.532
-0.462
-5.14%
jan 1, 1982
9.007
+0.475
5.57%
jan 1, 1983
11.91
+2.902
32.22%
jan 1, 1984
12.089
+0.179
1.5%
jan 1, 1985
11.728
-0.36
-2.98%
jan 1, 1986
11.378
-0.35
-2.99%
jan 1, 1987
10.195
-1.183
-10.4%
jan 1, 1988
10.772
+0.577
5.66%
jan 1, 1989
11.221
+0.448
4.16%
jan 1, 1990
11.871
+0.65
5.8%
jan 1, 1991
11.829
-0.042
-0.35%
jan 1, 1992
11.789
-0.041
-0.34%
jan 1, 1993
12.367
+0.578
4.91%
jan 1, 1994
12.112
-0.255
-2.06%
jan 1, 1995
12.241
+0.129
1.07%
jan 1, 1996
12.118
-0.124
-1.01%
jan 1, 1997
12.107
-0.011
-0.09%
jan 1, 1998
13.813
+1.706
14.09%
jan 1, 1999
13.958
+0.145
1.05%
jan 1, 2000
15.058
+1.1
7.88%
jan 1, 2001
16.903
+1.845
12.25%
jan 1, 2002
18.569
+1.667
9.86%
jan 1, 2003
17.242
-1.328
-7.15%
jan 1, 2004
16.292
-0.949
-5.51%
jan 1, 2005
17.152
+0.86
5.28%
jan 1, 2006
18.519
+1.367
7.97%
jan 1, 2007
19.61
+1.091
5.89%
jan 1, 2008
20.634
+1.025
5.22%
jan 1, 2009
21.943
+1.308
6.34%
jan 1, 2010
22.25
+0.308
1.4%
jan 1, 2011
20.789
-1.461
-6.57%
jan 1, 2012
21.316
+0.527
2.53%
jan 1, 2013
22.012
+0.696
3.27%
jan 1, 2014
23.318
+1.306
5.93%
jan 1, 2015
24.858
+1.54
6.6%
jan 1, 2016
26.609
+1.751
7.04%
Ranking of countries by current statistics by years


Comments: