29
/
en
AIzaSyAYiBZKx7MnpbEhh9jyipgxe19OcubqV5w
April 1, 2024
191022
Mali
MLI
true
2
1
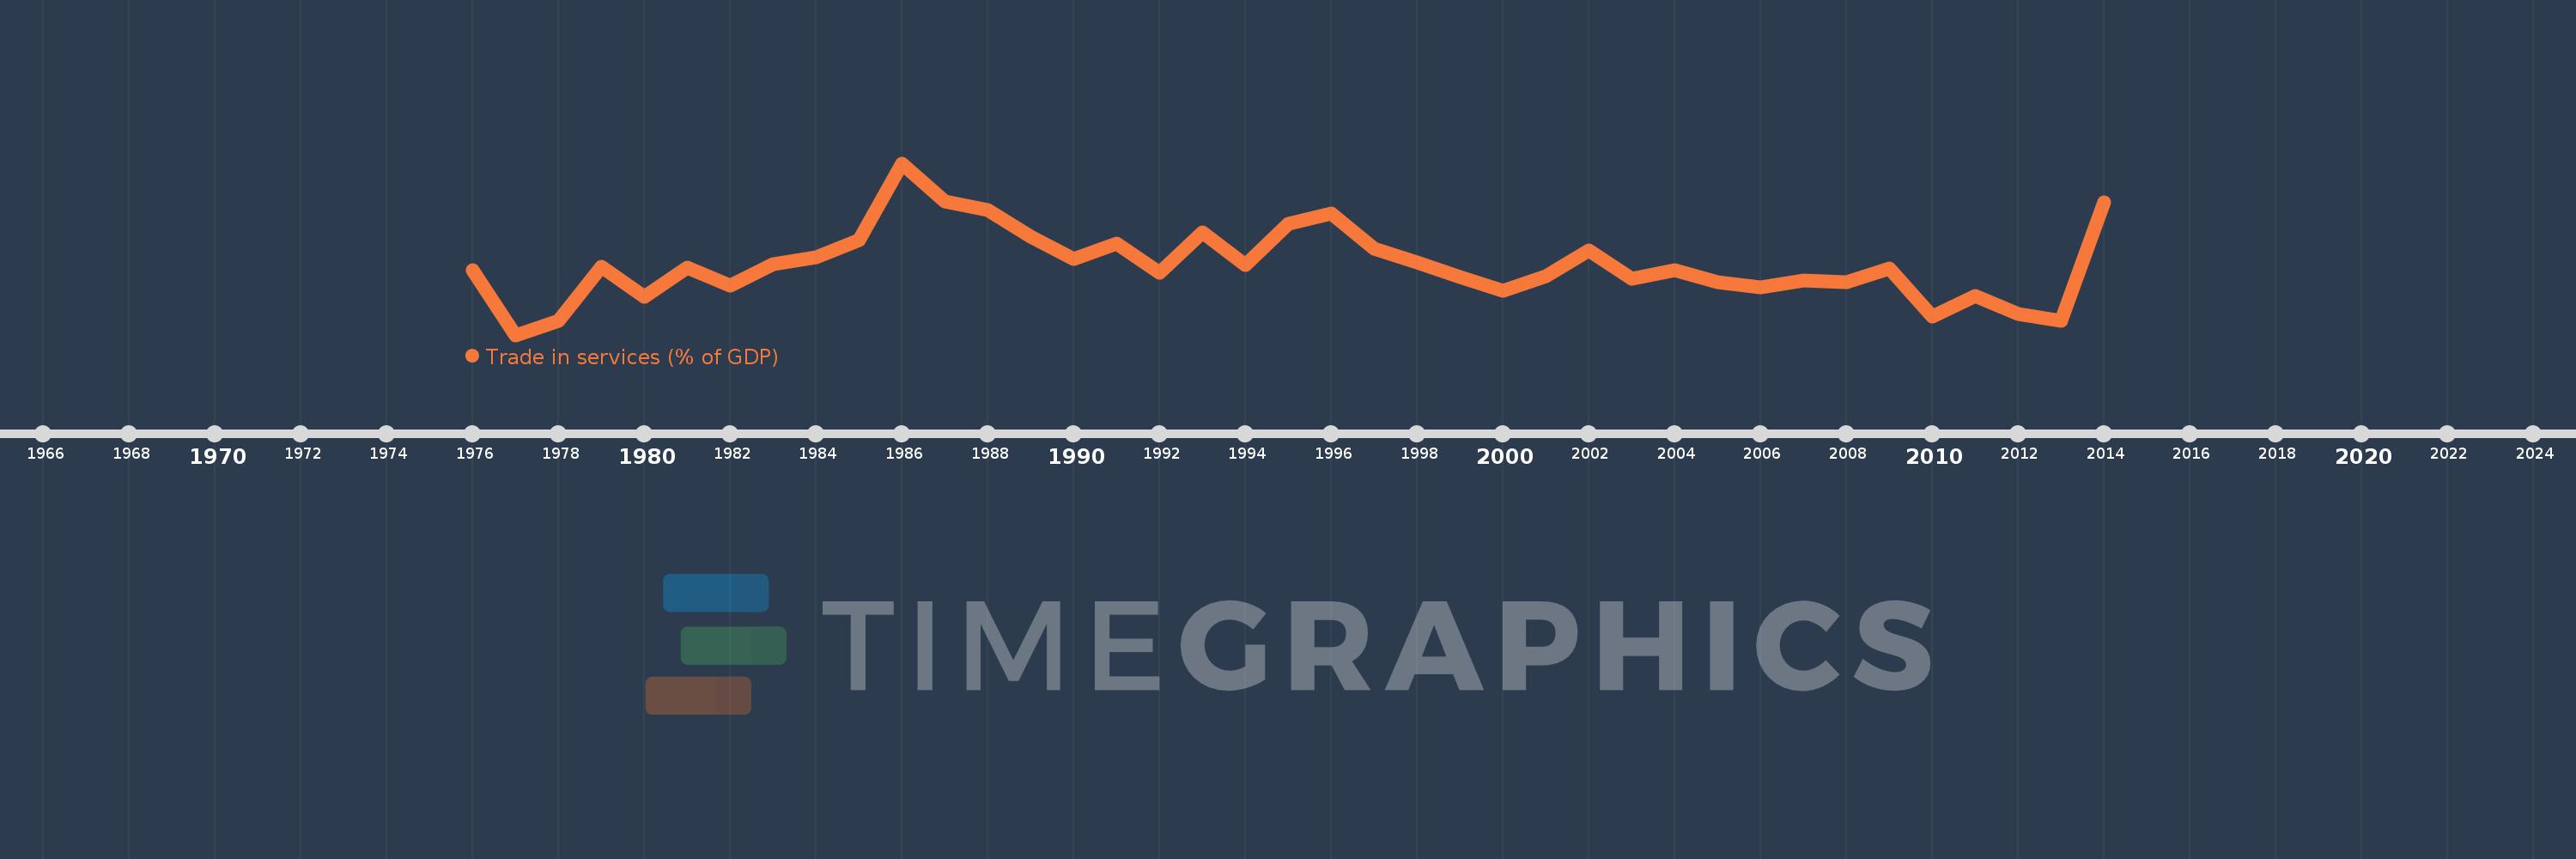
Trade in services (% of GDP)
2014,2013,2012,2011,2010,2009,2008,2007,2006,2005,2004,2003,2002,2001,2000,1999,1998,1997,1996,1995,1994,1993,1992,1991,1990,1989,1988,1987,1986,1985,1984,1983,1982,1981,1980,1979,1978,1977,1976
This statistics in other country:
AfghanistanAlbaniaAlgeriaAngolaAntigua and BarbudaArab WorldArgentinaArmeniaArubaAustraliaAustriaAzerbaijanBahamas, TheBahrainBangladeshBarbadosBelarusBelgiumBelizeBeninBermudaBhutanBoliviaBosnia and HerzegovinaBotswanaBrazilBrunei DarussalamBulgariaBurkina FasoBurundiCabo VerdeCambodiaCameroonCanadaCaribbean small statesCentral African RepublicCentral Europe and the BalticsChadChileChinaColombiaComorosCongo, Dem. Rep.Congo, Rep.Costa RicaCote d'IvoireCroatiaCyprusCzech RepublicDenmarkDjiboutiDominicaDominican RepublicEarly-demographic dividendEast Asia & PacificEast Asia & Pacific (excluding high income)East Asia & Pacific (IDA & IBRD countries)EcuadorEgypt, Arab Rep.El SalvadorEquatorial GuineaEritreaEstoniaEthiopiaEuro areaEurope & Central AsiaEurope & Central Asia (excluding high income)Europe & Central Asia (IDA & IBRD countries)European UnionFaroe IslandsFijiFinlandFragile and conflict affected situationsFranceGabonGambia, TheGeorgiaGermanyGhanaGreeceGrenadaGuatemalaGuineaGuinea-BissauGuyanaHaitiHeavily indebted poor countries (HIPC)High incomeHondurasHong Kong SAR, ChinaHungaryIBRD onlyIcelandIDA & IBRD totalIDA blendIDA onlyIDA totalIndiaIndonesiaIran, Islamic Rep.IraqIrelandIsraelItalyJamaicaJapanJordanKazakhstanKenyaKiribatiKorea, Rep.KosovoKuwaitKyrgyz RepublicLao PDRLate-demographic dividendLatin America & Caribbean Latin America & Caribbean (excluding high income)Latin America & the Caribbean (IDA & IBRD countries)LatviaLeast developed countries: UN classificationLebanonLesothoLiberiaLibyaLithuaniaLow & middle incomeLow incomeLower middle incomeLuxembourgMacao SAR, ChinaMacedonia, FYRMadagascarMalawiMalaysiaMaldivesMaliMaltaMarshall IslandsMauritaniaMauritiusMexicoMicronesia, Fed. Sts.Middle East & North AfricaMiddle East & North Africa (excluding high income)Middle East & North Africa (IDA & IBRD countries)Middle incomeMoldovaMongoliaMontenegroMoroccoMozambiqueMyanmarNamibiaNepalNetherlandsNew ZealandNicaraguaNigerNigeriaNorth AmericaNorwayOECD membersOmanOther small statesPacific island small statesPakistanPalauPanamaPapua New GuineaParaguayPeruPhilippinesPolandPortugalPost-demographic dividendPre-demographic dividendQatarRomaniaRussian FederationRwandaSamoaSao Tome and PrincipeSaudi ArabiaSenegalSerbiaSeychellesSierra LeoneSingaporeSlovak RepublicSloveniaSmall statesSolomon IslandsSouth AfricaSouth AsiaSouth Asia (IDA & IBRD)South SudanSpainSri LankaSt. Kitts and NevisSt. LuciaSt. Vincent and the GrenadinesSub-Saharan Africa Sub-Saharan Africa (excluding high income)Sub-Saharan Africa (IDA & IBRD countries)SudanSurinameSwazilandSwedenSwitzerlandSyrian Arab RepublicTajikistanTanzaniaThailandTimor-LesteTogoTongaTrinidad and TobagoTunisiaTurkeyTuvaluUgandaUkraineUnited KingdomUnited StatesUpper middle incomeUruguayVanuatuVenezuela, RBVietnamWest Bank and GazaWorldYemen, Rep.ZambiaZimbabwe Timeline:
This timeline shows a graph from 1976 to 2014 of Mali. No data until 1975. Number of actual observations by date: 39.
Source name:
World Development Indicators
Source organization:
International Monetary Fund, Balance of Payments Statistics Yearbook and data files, and World Bank and OECD GDP estimates.
Categories, topics:
Economy & Growth, Private Sector, Trade
Last updated:
apr 23, 2017
Indicators value changes by year
Minimum:
10.284
jan 1, 1977
Maximum:
23.058
jan 1, 1986
At the date of observation
Value
Absolute change
Change from previous value
jan 1, 1976
15.09
+15.09
0.0%
jan 1, 1977
10.284
-4.806
-31.85%
jan 1, 1978
11.368
+1.084
10.54%
jan 1, 1979
15.367
+4.0
35.18%
jan 1, 1980
13.127
-2.24
-14.58%
jan 1, 1981
15.318
+2.191
16.69%
jan 1, 1982
13.977
-1.341
-8.75%
jan 1, 1983
15.527
+1.55
11.09%
jan 1, 1984
16.096
+0.569
3.67%
jan 1, 1985
17.331
+1.235
7.67%
jan 1, 1986
23.058
+5.727
33.04%
jan 1, 1987
20.238
-2.82
-12.23%
jan 1, 1988
19.592
-0.646
-3.19%
jan 1, 1989
17.584
-2.008
-10.25%
jan 1, 1990
15.915
-1.669
-9.49%
jan 1, 1991
17.115
+1.2
7.54%
jan 1, 1992
14.889
-2.226
-13.01%
jan 1, 1993
17.907
+3.018
20.27%
jan 1, 1994
15.458
-2.449
-13.68%
jan 1, 1995
18.542
+3.084
19.95%
jan 1, 1996
19.291
+0.749
4.04%
jan 1, 1997
16.705
-2.587
-13.41%
jan 1, 1998
15.695
-1.01
-6.05%
jan 1, 1999
14.572
-1.122
-7.15%
jan 1, 2000
13.571
-1.001
-6.87%
jan 1, 2001
14.685
+1.114
8.21%
jan 1, 2002
16.561
+1.876
12.77%
jan 1, 2003
14.448
-2.112
-12.76%
jan 1, 2004
15.089
+0.641
4.44%
jan 1, 2005
14.234
-0.855
-5.67%
jan 1, 2006
13.839
-0.395
-2.78%
jan 1, 2007
14.348
+0.508
3.67%
jan 1, 2008
14.183
-0.165
-1.15%
jan 1, 2009
15.202
+1.02
7.19%
jan 1, 2010
11.643
-3.559
-23.41%
jan 1, 2011
13.216
+1.573
13.51%
jan 1, 2012
11.86
-1.356
-10.26%
jan 1, 2013
11.326
-0.535
-4.51%
jan 1, 2014
20.182
+8.857
78.2%
Ranking of countries by current statistics by years


Comments: