29
/
en
AIzaSyAYiBZKx7MnpbEhh9jyipgxe19OcubqV5w
April 1, 2024
220327
Papua New Guinea
PNG
true
2
1
Trade in services (% of GDP)
2015,2014,2013,2012,2011,2010,2009,2008,2007,2006,2005,2004,2003,2002,2001,2000,1999,1998,1997,1996,1995,1994,1993,1992,1991,1990,1989,1988,1987,1986,1985,1984,1983,1982,1981,1980,1979,1978,1977
This statistics in other country:
AfghanistanAlbaniaAlgeriaAngolaAntigua and BarbudaArab WorldArgentinaArmeniaArubaAustraliaAustriaAzerbaijanBahamas, TheBahrainBangladeshBarbadosBelarusBelgiumBelizeBeninBermudaBhutanBoliviaBosnia and HerzegovinaBotswanaBrazilBrunei DarussalamBulgariaBurkina FasoBurundiCabo VerdeCambodiaCameroonCanadaCaribbean small statesCentral African RepublicCentral Europe and the BalticsChadChileChinaColombiaComorosCongo, Dem. Rep.Congo, Rep.Costa RicaCote d'IvoireCroatiaCyprusCzech RepublicDenmarkDjiboutiDominicaDominican RepublicEarly-demographic dividendEast Asia & PacificEast Asia & Pacific (excluding high income)East Asia & Pacific (IDA & IBRD countries)EcuadorEgypt, Arab Rep.El SalvadorEquatorial GuineaEritreaEstoniaEthiopiaEuro areaEurope & Central AsiaEurope & Central Asia (excluding high income)Europe & Central Asia (IDA & IBRD countries)European UnionFaroe IslandsFijiFinlandFragile and conflict affected situationsFranceGabonGambia, TheGeorgiaGermanyGhanaGreeceGrenadaGuatemalaGuineaGuinea-BissauGuyanaHaitiHeavily indebted poor countries (HIPC)High incomeHondurasHong Kong SAR, ChinaHungaryIBRD onlyIcelandIDA & IBRD totalIDA blendIDA onlyIDA totalIndiaIndonesiaIran, Islamic Rep.IraqIrelandIsraelItalyJamaicaJapanJordanKazakhstanKenyaKiribatiKorea, Rep.KosovoKuwaitKyrgyz RepublicLao PDRLate-demographic dividendLatin America & Caribbean Latin America & Caribbean (excluding high income)Latin America & the Caribbean (IDA & IBRD countries)LatviaLeast developed countries: UN classificationLebanonLesothoLiberiaLibyaLithuaniaLow & middle incomeLow incomeLower middle incomeLuxembourgMacao SAR, ChinaMacedonia, FYRMadagascarMalawiMalaysiaMaldivesMaliMaltaMarshall IslandsMauritaniaMauritiusMexicoMicronesia, Fed. Sts.Middle East & North AfricaMiddle East & North Africa (excluding high income)Middle East & North Africa (IDA & IBRD countries)Middle incomeMoldovaMongoliaMontenegroMoroccoMozambiqueMyanmarNamibiaNepalNetherlandsNew ZealandNicaraguaNigerNigeriaNorth AmericaNorwayOECD membersOmanOther small statesPacific island small statesPakistanPalauPanamaPapua New GuineaParaguayPeruPhilippinesPolandPortugalPost-demographic dividendPre-demographic dividendQatarRomaniaRussian FederationRwandaSamoaSao Tome and PrincipeSaudi ArabiaSenegalSerbiaSeychellesSierra LeoneSingaporeSlovak RepublicSloveniaSmall statesSolomon IslandsSouth AfricaSouth AsiaSouth Asia (IDA & IBRD)South SudanSpainSri LankaSt. Kitts and NevisSt. LuciaSt. Vincent and the GrenadinesSub-Saharan Africa Sub-Saharan Africa (excluding high income)Sub-Saharan Africa (IDA & IBRD countries)SudanSurinameSwazilandSwedenSwitzerlandSyrian Arab RepublicTajikistanTanzaniaThailandTimor-LesteTogoTongaTrinidad and TobagoTunisiaTurkeyTuvaluUgandaUkraineUnited KingdomUnited StatesUpper middle incomeUruguayVanuatuVenezuela, RBVietnamWest Bank and GazaWorldYemen, Rep.ZambiaZimbabwe Timeline:
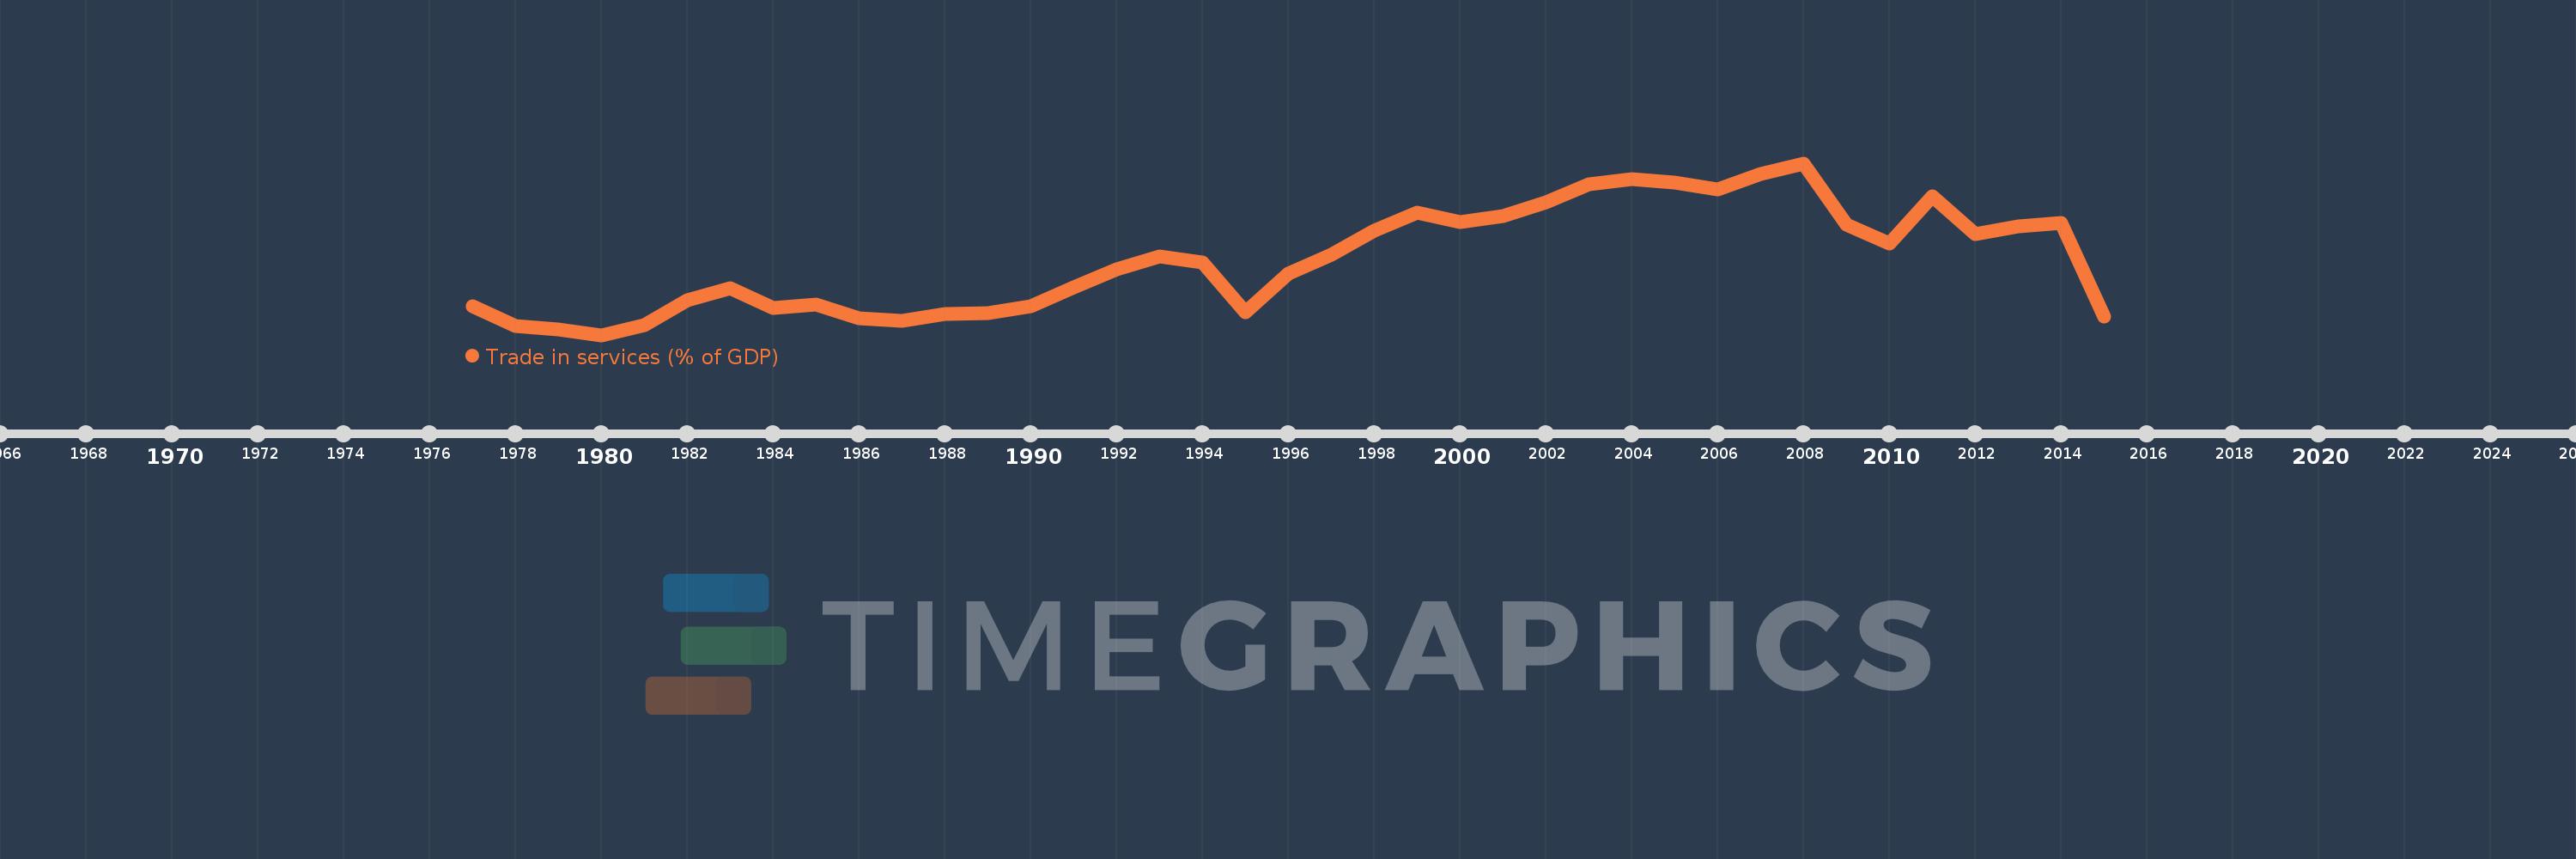
This timeline shows a graph from 1977 to 2015 of Papua New Guinea. No data until 1976. Number of actual observations by date: 39.
Source name:
World Development Indicators
Source organization:
International Monetary Fund, Balance of Payments Statistics Yearbook and data files, and World Bank and OECD GDP estimates.
Categories, topics:
Economy & Growth, Private Sector, Trade
Last updated:
apr 23, 2017
Indicators value changes by year
Minimum:
12.193
jan 1, 1980
Maximum:
36.242
jan 1, 2008
At the date of observation
Value
Absolute change
Change from previous value
jan 1, 1977
16.178
+16.178
0.0%
jan 1, 1978
13.514
-2.663
-16.46%
jan 1, 1979
12.978
-0.536
-3.97%
jan 1, 1980
12.193
-0.785
-6.05%
jan 1, 1981
13.548
+1.355
11.11%
jan 1, 1982
17.084
+3.536
26.1%
jan 1, 1983
18.712
+1.628
9.53%
jan 1, 1984
15.963
-2.749
-14.69%
jan 1, 1985
16.473
+0.509
3.19%
jan 1, 1986
14.547
-1.926
-11.69%
jan 1, 1987
14.167
-0.381
-2.62%
jan 1, 1988
15.106
+0.939
6.63%
jan 1, 1989
15.246
+0.141
0.93%
jan 1, 1990
16.261
+1.015
6.66%
jan 1, 1991
18.904
+2.643
16.25%
jan 1, 1992
21.389
+2.485
13.14%
jan 1, 1993
23.185
+1.796
8.4%
jan 1, 1994
22.339
-0.846
-3.65%
jan 1, 1995
15.329
-7.01
-31.38%
jan 1, 1996
20.782
+5.454
35.58%
jan 1, 1997
23.484
+2.701
13.0%
jan 1, 1998
26.749
+3.265
13.9%
jan 1, 1999
29.341
+2.592
9.69%
jan 1, 2000
28.052
-1.289
-4.39%
jan 1, 2001
28.822
+0.77
2.75%
jan 1, 2002
30.741
+1.918
6.66%
jan 1, 2003
33.268
+2.527
8.22%
jan 1, 2004
34.004
+0.736
2.21%
jan 1, 2005
33.522
-0.482
-1.42%
jan 1, 2006
32.528
-0.994
-2.96%
jan 1, 2007
34.701
+2.173
6.68%
jan 1, 2008
36.242
+1.541
4.44%
jan 1, 2009
27.652
-8.59
-23.7%
jan 1, 2010
24.988
-2.663
-9.63%
jan 1, 2011
31.567
+6.579
26.33%
jan 1, 2012
26.329
-5.238
-16.59%
jan 1, 2013
27.364
+1.035
3.93%
jan 1, 2014
27.932
+0.568
2.08%
jan 1, 2015
14.741
-13.191
-47.22%
Ranking of countries by current statistics by years


Comments: