29
/
en
AIzaSyAYiBZKx7MnpbEhh9jyipgxe19OcubqV5w
April 1, 2024
143656
Grenada
GRD
true
2
1
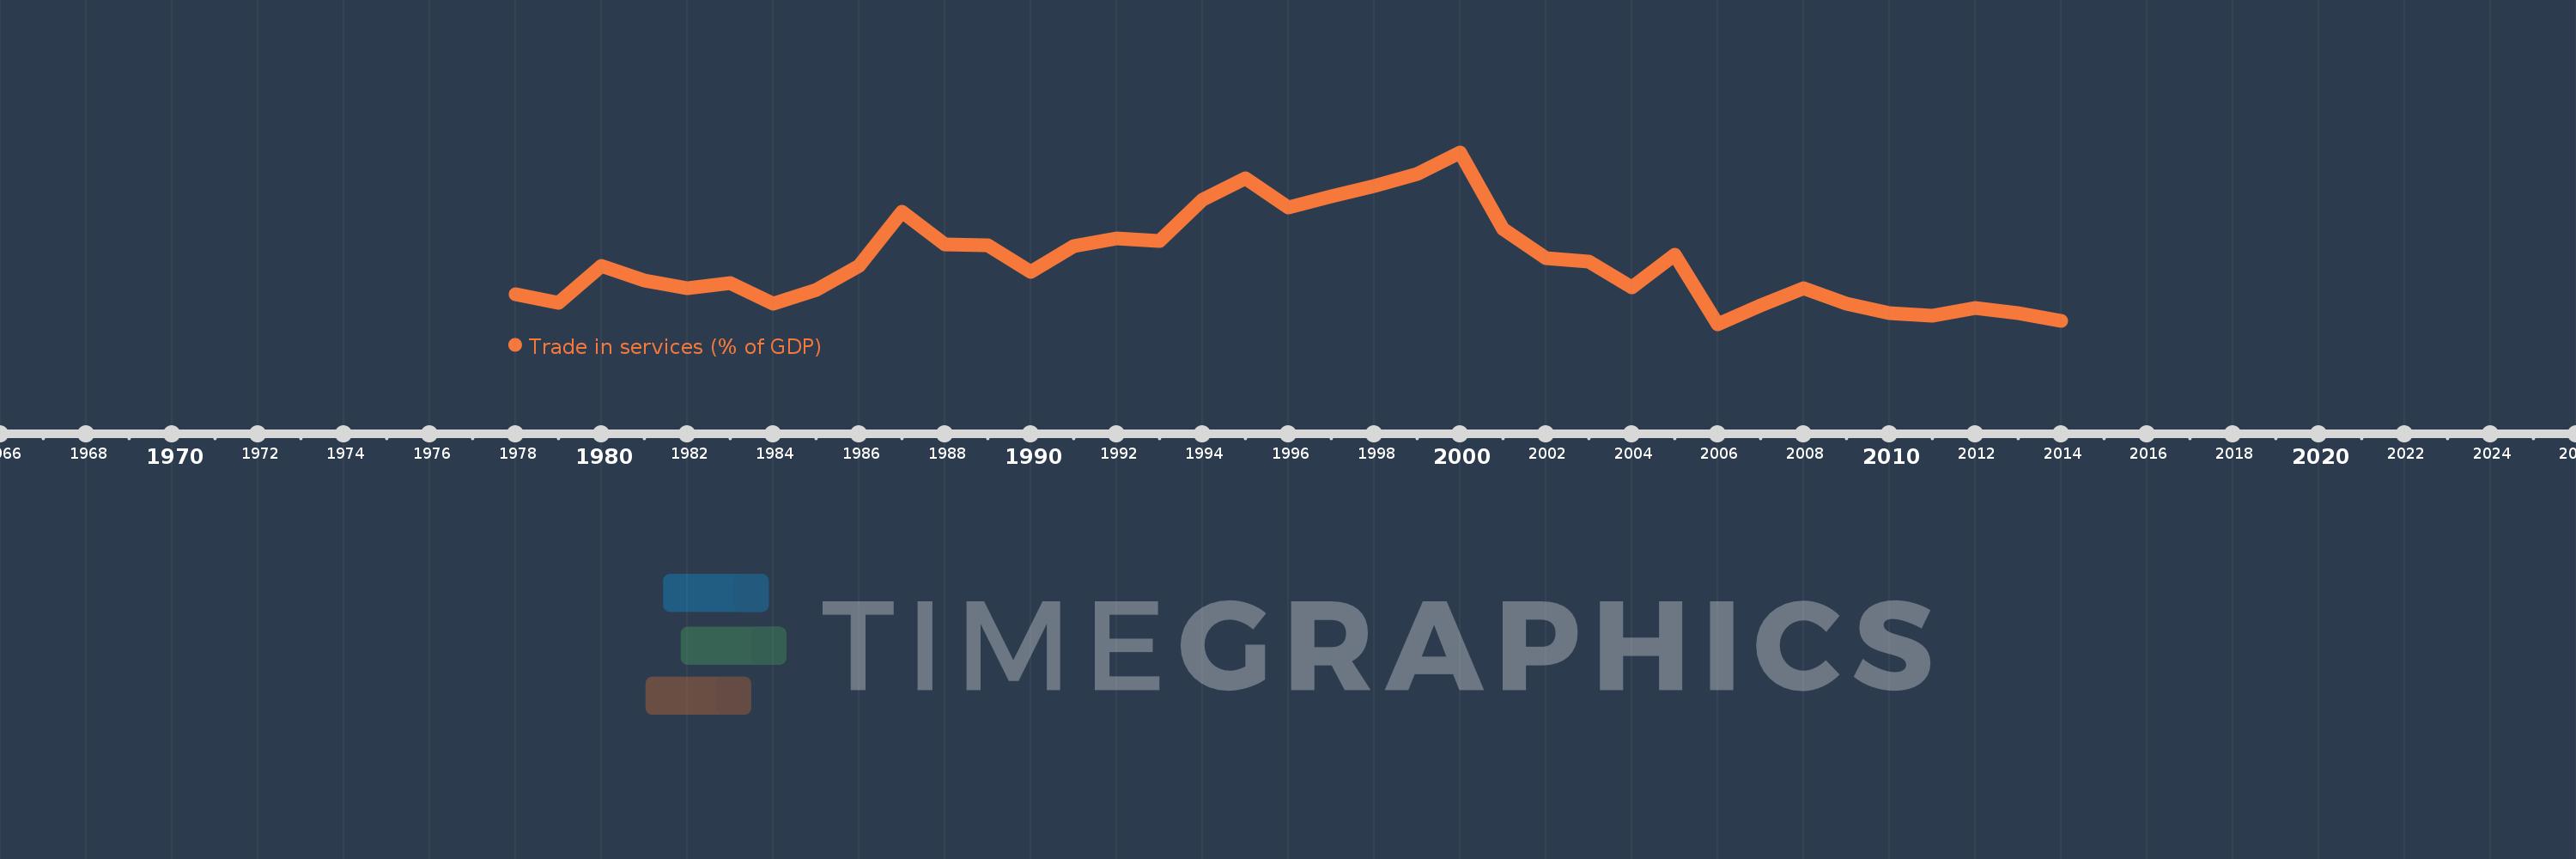
Trade in services (% of GDP)
2014,2013,2012,2011,2010,2009,2008,2007,2006,2005,2004,2003,2002,2001,2000,1999,1998,1997,1996,1995,1994,1993,1992,1991,1990,1989,1988,1987,1986,1985,1984,1983,1982,1981,1980,1979,1978
This statistics in other country:
AfghanistanAlbaniaAlgeriaAngolaAntigua and BarbudaArab WorldArgentinaArmeniaArubaAustraliaAustriaAzerbaijanBahamas, TheBahrainBangladeshBarbadosBelarusBelgiumBelizeBeninBermudaBhutanBoliviaBosnia and HerzegovinaBotswanaBrazilBrunei DarussalamBulgariaBurkina FasoBurundiCabo VerdeCambodiaCameroonCanadaCaribbean small statesCentral African RepublicCentral Europe and the BalticsChadChileChinaColombiaComorosCongo, Dem. Rep.Congo, Rep.Costa RicaCote d'IvoireCroatiaCyprusCzech RepublicDenmarkDjiboutiDominicaDominican RepublicEarly-demographic dividendEast Asia & PacificEast Asia & Pacific (excluding high income)East Asia & Pacific (IDA & IBRD countries)EcuadorEgypt, Arab Rep.El SalvadorEquatorial GuineaEritreaEstoniaEthiopiaEuro areaEurope & Central AsiaEurope & Central Asia (excluding high income)Europe & Central Asia (IDA & IBRD countries)European UnionFaroe IslandsFijiFinlandFragile and conflict affected situationsFranceGabonGambia, TheGeorgiaGermanyGhanaGreeceGrenadaGuatemalaGuineaGuinea-BissauGuyanaHaitiHeavily indebted poor countries (HIPC)High incomeHondurasHong Kong SAR, ChinaHungaryIBRD onlyIcelandIDA & IBRD totalIDA blendIDA onlyIDA totalIndiaIndonesiaIran, Islamic Rep.IraqIrelandIsraelItalyJamaicaJapanJordanKazakhstanKenyaKiribatiKorea, Rep.KosovoKuwaitKyrgyz RepublicLao PDRLate-demographic dividendLatin America & Caribbean Latin America & Caribbean (excluding high income)Latin America & the Caribbean (IDA & IBRD countries)LatviaLeast developed countries: UN classificationLebanonLesothoLiberiaLibyaLithuaniaLow & middle incomeLow incomeLower middle incomeLuxembourgMacao SAR, ChinaMacedonia, FYRMadagascarMalawiMalaysiaMaldivesMaliMaltaMarshall IslandsMauritaniaMauritiusMexicoMicronesia, Fed. Sts.Middle East & North AfricaMiddle East & North Africa (excluding high income)Middle East & North Africa (IDA & IBRD countries)Middle incomeMoldovaMongoliaMontenegroMoroccoMozambiqueMyanmarNamibiaNepalNetherlandsNew ZealandNicaraguaNigerNigeriaNorth AmericaNorwayOECD membersOmanOther small statesPacific island small statesPakistanPalauPanamaPapua New GuineaParaguayPeruPhilippinesPolandPortugalPost-demographic dividendPre-demographic dividendQatarRomaniaRussian FederationRwandaSamoaSao Tome and PrincipeSaudi ArabiaSenegalSerbiaSeychellesSierra LeoneSingaporeSlovak RepublicSloveniaSmall statesSolomon IslandsSouth AfricaSouth AsiaSouth Asia (IDA & IBRD)South SudanSpainSri LankaSt. Kitts and NevisSt. LuciaSt. Vincent and the GrenadinesSub-Saharan Africa Sub-Saharan Africa (excluding high income)Sub-Saharan Africa (IDA & IBRD countries)SudanSurinameSwazilandSwedenSwitzerlandSyrian Arab RepublicTajikistanTanzaniaThailandTimor-LesteTogoTongaTrinidad and TobagoTunisiaTurkeyTuvaluUgandaUkraineUnited KingdomUnited StatesUpper middle incomeUruguayVanuatuVenezuela, RBVietnamWest Bank and GazaWorldYemen, Rep.ZambiaZimbabwe Timeline:
This timeline shows a graph from 1978 to 2014 of Grenada. No data until 1977. Number of actual observations by date: 37.
Source name:
World Development Indicators
Source organization:
International Monetary Fund, Balance of Payments Statistics Yearbook and data files, and World Bank and OECD GDP estimates.
Categories, topics:
Economy & Growth, Private Sector, Trade
Last updated:
apr 23, 2017
Indicators value changes by year
Minimum:
30.517
jan 1, 2006
Maximum:
59.383
jan 1, 2000
At the date of observation
Value
Absolute change
Change from previous value
jan 1, 1978
35.542
+35.542
0.0%
jan 1, 1979
34.05
-1.492
-4.2%
jan 1, 1980
40.312
+6.262
18.39%
jan 1, 1981
37.872
-2.44
-6.05%
jan 1, 1982
36.511
-1.361
-3.59%
jan 1, 1983
37.461
+0.95
2.6%
jan 1, 1984
34.01
-3.451
-9.21%
jan 1, 1985
36.31
+2.3
6.76%
jan 1, 1986
40.298
+3.988
10.98%
jan 1, 1987
49.374
+9.076
22.52%
jan 1, 1988
43.974
-5.4
-10.94%
jan 1, 1989
43.734
-0.24
-0.55%
jan 1, 1990
39.337
-4.397
-10.05%
jan 1, 1991
43.581
+4.244
10.79%
jan 1, 1992
44.988
+1.407
3.23%
jan 1, 1993
44.436
-0.552
-1.23%
jan 1, 1994
51.498
+7.062
15.89%
jan 1, 1995
55.006
+3.508
6.81%
jan 1, 1996
50.172
-4.834
-8.79%
jan 1, 1997
52.05
+1.879
3.74%
jan 1, 1998
53.729
+1.679
3.22%
jan 1, 1999
55.728
+1.999
3.72%
jan 1, 2000
59.383
+3.655
6.56%
jan 1, 2001
46.528
-12.856
-21.65%
jan 1, 2002
41.677
-4.851
-10.43%
jan 1, 2003
41.067
-0.61
-1.46%
jan 1, 2004
36.713
-4.354
-10.6%
jan 1, 2005
42.162
+5.449
14.84%
jan 1, 2006
30.517
-11.646
-27.62%
jan 1, 2007
33.69
+3.174
10.4%
jan 1, 2008
36.559
+2.869
8.52%
jan 1, 2009
33.938
-2.621
-7.17%
jan 1, 2010
32.42
-1.518
-4.47%
jan 1, 2011
31.988
-0.432
-1.33%
jan 1, 2012
33.292
+1.304
4.08%
jan 1, 2013
32.386
-0.907
-2.72%
jan 1, 2014
31.122
-1.263
-3.9%
Ranking of countries by current statistics by years


Comments: