29
/
en
AIzaSyAYiBZKx7MnpbEhh9jyipgxe19OcubqV5w
April 1, 2024
165650
Jordan
JOR
true
2
1
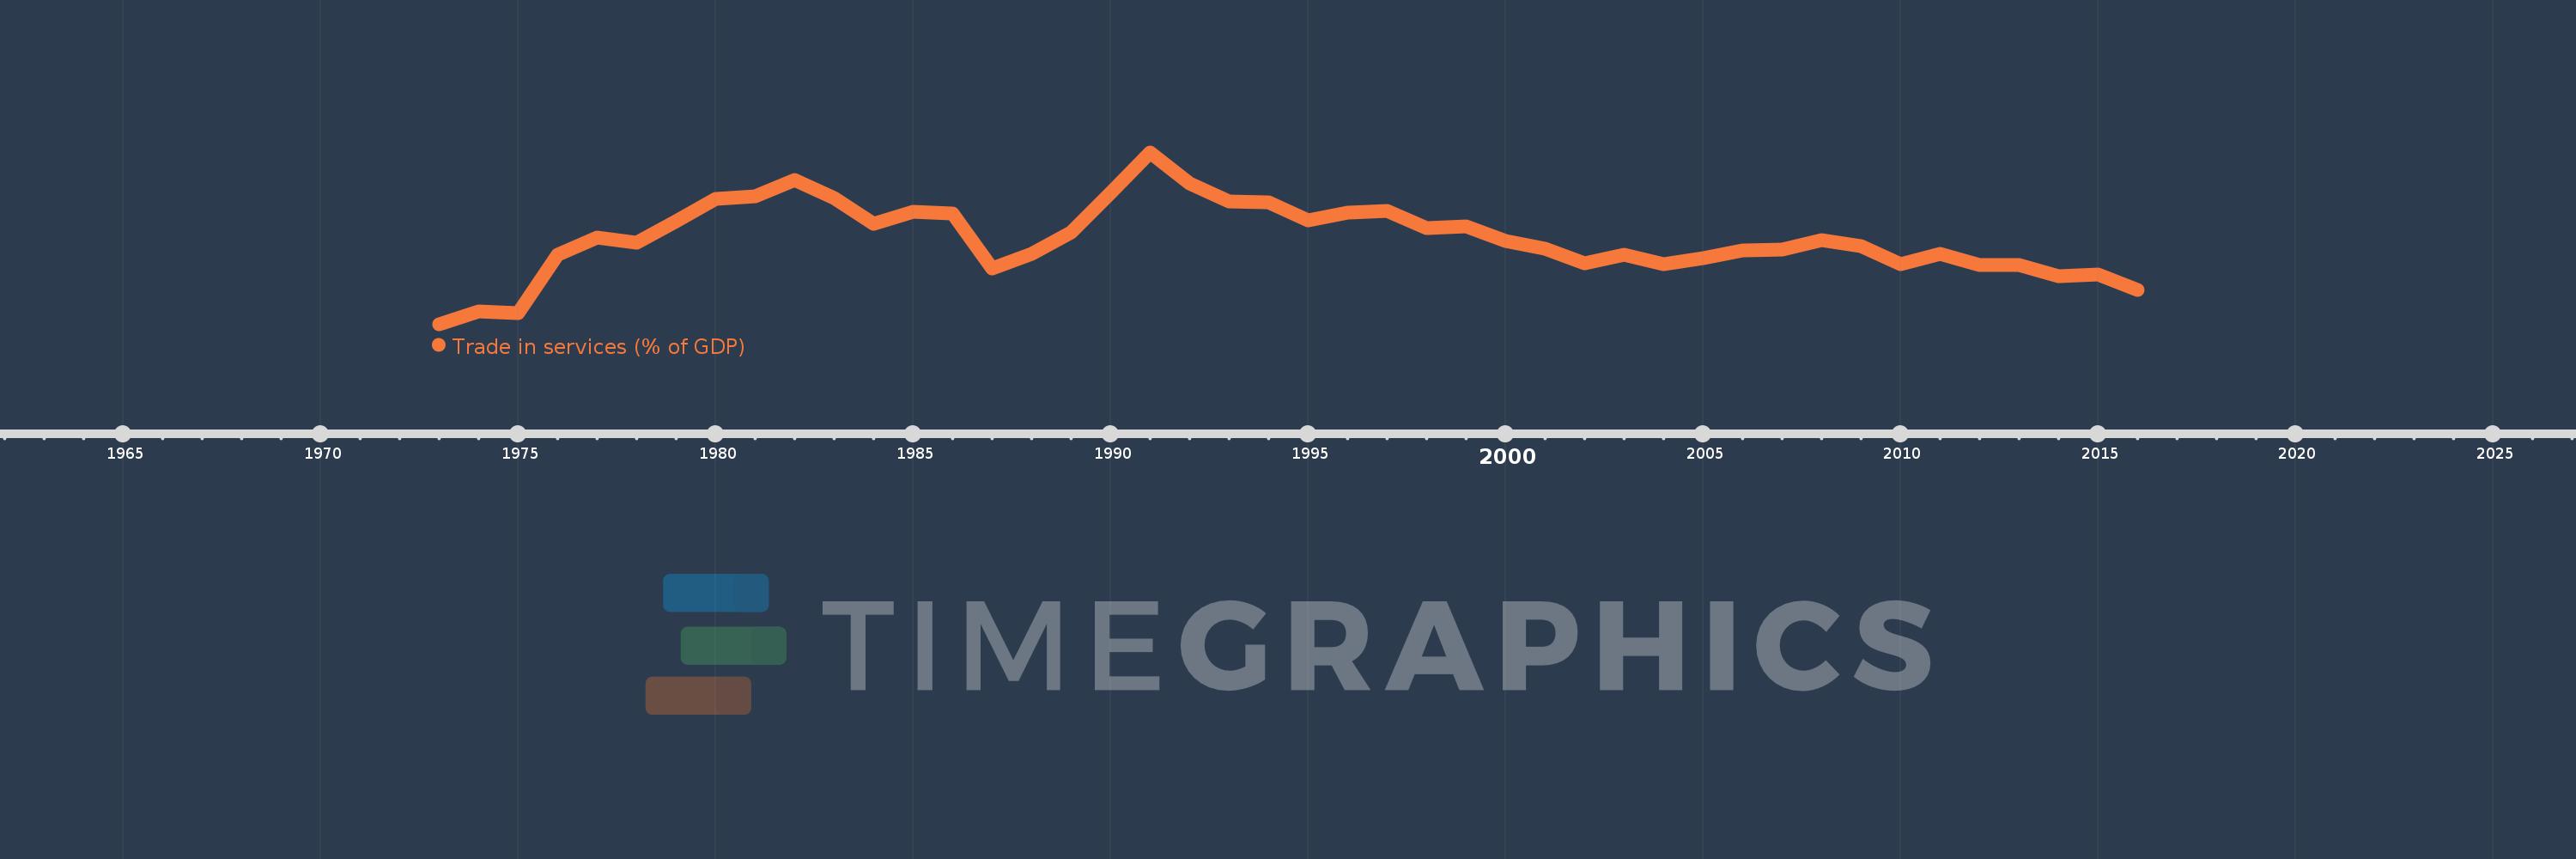
Trade in services (% of GDP)
2016,2015,2014,2013,2012,2011,2010,2009,2008,2007,2006,2005,2004,2003,2002,2001,2000,1999,1998,1997,1996,1995,1994,1993,1992,1991,1990,1989,1988,1987,1986,1985,1984,1983,1982,1981,1980,1979,1978,1977,1976,1975,1974,1973
This statistics in other country:
AfghanistanAlbaniaAlgeriaAngolaAntigua and BarbudaArab WorldArgentinaArmeniaArubaAustraliaAustriaAzerbaijanBahamas, TheBahrainBangladeshBarbadosBelarusBelgiumBelizeBeninBermudaBhutanBoliviaBosnia and HerzegovinaBotswanaBrazilBrunei DarussalamBulgariaBurkina FasoBurundiCabo VerdeCambodiaCameroonCanadaCaribbean small statesCentral African RepublicCentral Europe and the BalticsChadChileChinaColombiaComorosCongo, Dem. Rep.Congo, Rep.Costa RicaCote d'IvoireCroatiaCyprusCzech RepublicDenmarkDjiboutiDominicaDominican RepublicEarly-demographic dividendEast Asia & PacificEast Asia & Pacific (excluding high income)East Asia & Pacific (IDA & IBRD countries)EcuadorEgypt, Arab Rep.El SalvadorEquatorial GuineaEritreaEstoniaEthiopiaEuro areaEurope & Central AsiaEurope & Central Asia (excluding high income)Europe & Central Asia (IDA & IBRD countries)European UnionFaroe IslandsFijiFinlandFragile and conflict affected situationsFranceGabonGambia, TheGeorgiaGermanyGhanaGreeceGrenadaGuatemalaGuineaGuinea-BissauGuyanaHaitiHeavily indebted poor countries (HIPC)High incomeHondurasHong Kong SAR, ChinaHungaryIBRD onlyIcelandIDA & IBRD totalIDA blendIDA onlyIDA totalIndiaIndonesiaIran, Islamic Rep.IraqIrelandIsraelItalyJamaicaJapanJordanKazakhstanKenyaKiribatiKorea, Rep.KosovoKuwaitKyrgyz RepublicLao PDRLate-demographic dividendLatin America & Caribbean Latin America & Caribbean (excluding high income)Latin America & the Caribbean (IDA & IBRD countries)LatviaLeast developed countries: UN classificationLebanonLesothoLiberiaLibyaLithuaniaLow & middle incomeLow incomeLower middle incomeLuxembourgMacao SAR, ChinaMacedonia, FYRMadagascarMalawiMalaysiaMaldivesMaliMaltaMarshall IslandsMauritaniaMauritiusMexicoMicronesia, Fed. Sts.Middle East & North AfricaMiddle East & North Africa (excluding high income)Middle East & North Africa (IDA & IBRD countries)Middle incomeMoldovaMongoliaMontenegroMoroccoMozambiqueMyanmarNamibiaNepalNetherlandsNew ZealandNicaraguaNigerNigeriaNorth AmericaNorwayOECD membersOmanOther small statesPacific island small statesPakistanPalauPanamaPapua New GuineaParaguayPeruPhilippinesPolandPortugalPost-demographic dividendPre-demographic dividendQatarRomaniaRussian FederationRwandaSamoaSao Tome and PrincipeSaudi ArabiaSenegalSerbiaSeychellesSierra LeoneSingaporeSlovak RepublicSloveniaSmall statesSolomon IslandsSouth AfricaSouth AsiaSouth Asia (IDA & IBRD)South SudanSpainSri LankaSt. Kitts and NevisSt. LuciaSt. Vincent and the GrenadinesSub-Saharan Africa Sub-Saharan Africa (excluding high income)Sub-Saharan Africa (IDA & IBRD countries)SudanSurinameSwazilandSwedenSwitzerlandSyrian Arab RepublicTajikistanTanzaniaThailandTimor-LesteTogoTongaTrinidad and TobagoTunisiaTurkeyTuvaluUgandaUkraineUnited KingdomUnited StatesUpper middle incomeUruguayVanuatuVenezuela, RBVietnamWest Bank and GazaWorldYemen, Rep.ZambiaZimbabwe Timeline:
This timeline shows a graph from 1973 to 2016 of Jordan. No data until 1972. Number of actual observations by date: 44.
Source name:
World Development Indicators
Source organization:
International Monetary Fund, Balance of Payments Statistics Yearbook and data files, and World Bank and OECD GDP estimates.
Categories, topics:
Economy & Growth, Private Sector, Trade
Last updated:
apr 23, 2017
Indicators value changes by year
Minimum:
19.742
jan 1, 1973
Maximum:
65.265
jan 1, 1991
At the date of observation
Value
Absolute change
Change from previous value
jan 1, 1973
19.742
+19.742
0.0%
jan 1, 1974
23.124
+3.382
17.13%
jan 1, 1975
22.583
-0.541
-2.34%
jan 1, 1976
38.129
+15.546
68.84%
jan 1, 1977
42.819
+4.69
12.3%
jan 1, 1978
41.424
-1.395
-3.26%
jan 1, 1979
46.985
+5.561
13.42%
jan 1, 1980
52.969
+5.984
12.74%
jan 1, 1981
53.637
+0.668
1.26%
jan 1, 1982
58.069
+4.432
8.26%
jan 1, 1983
53.176
-4.893
-8.43%
jan 1, 1984
46.419
-6.757
-12.71%
jan 1, 1985
49.554
+3.135
6.75%
jan 1, 1986
49.141
-0.413
-0.83%
jan 1, 1987
34.513
-14.628
-29.77%
jan 1, 1988
38.338
+3.825
11.08%
jan 1, 1989
43.986
+5.648
14.73%
jan 1, 1990
54.55
+10.563
24.02%
jan 1, 1991
65.265
+10.715
19.64%
jan 1, 1992
56.943
-8.322
-12.75%
jan 1, 1993
52.227
-4.716
-8.28%
jan 1, 1994
52.103
-0.124
-0.24%
jan 1, 1995
47.368
-4.735
-9.09%
jan 1, 1996
49.411
+2.043
4.31%
jan 1, 1997
49.709
+0.298
0.6%
jan 1, 1998
45.194
-4.515
-9.08%
jan 1, 1999
45.621
+0.427
0.94%
jan 1, 2000
41.727
-3.894
-8.53%
jan 1, 2001
39.745
-1.982
-4.75%
jan 1, 2002
35.81
-3.935
-9.9%
jan 1, 2003
38.257
+2.446
6.83%
jan 1, 2004
35.685
-2.571
-6.72%
jan 1, 2005
37.357
+1.671
4.68%
jan 1, 2006
39.356
+2.0
5.35%
jan 1, 2007
39.633
+0.277
0.7%
jan 1, 2008
41.924
+2.291
5.78%
jan 1, 2009
40.454
-1.47
-3.51%
jan 1, 2010
35.702
-4.752
-11.75%
jan 1, 2011
38.382
+2.68
7.51%
jan 1, 2012
35.412
-2.97
-7.74%
jan 1, 2013
35.443
+0.031
0.09%
jan 1, 2014
32.526
-2.918
-8.23%
jan 1, 2015
32.863
+0.337
1.04%
jan 1, 2016
28.797
-4.066
-12.37%
Ranking of countries by current statistics by years


Comments: