29
/
en
AIzaSyAYiBZKx7MnpbEhh9jyipgxe19OcubqV5w
April 1, 2024
101672
Canada
CAN
true
2
1
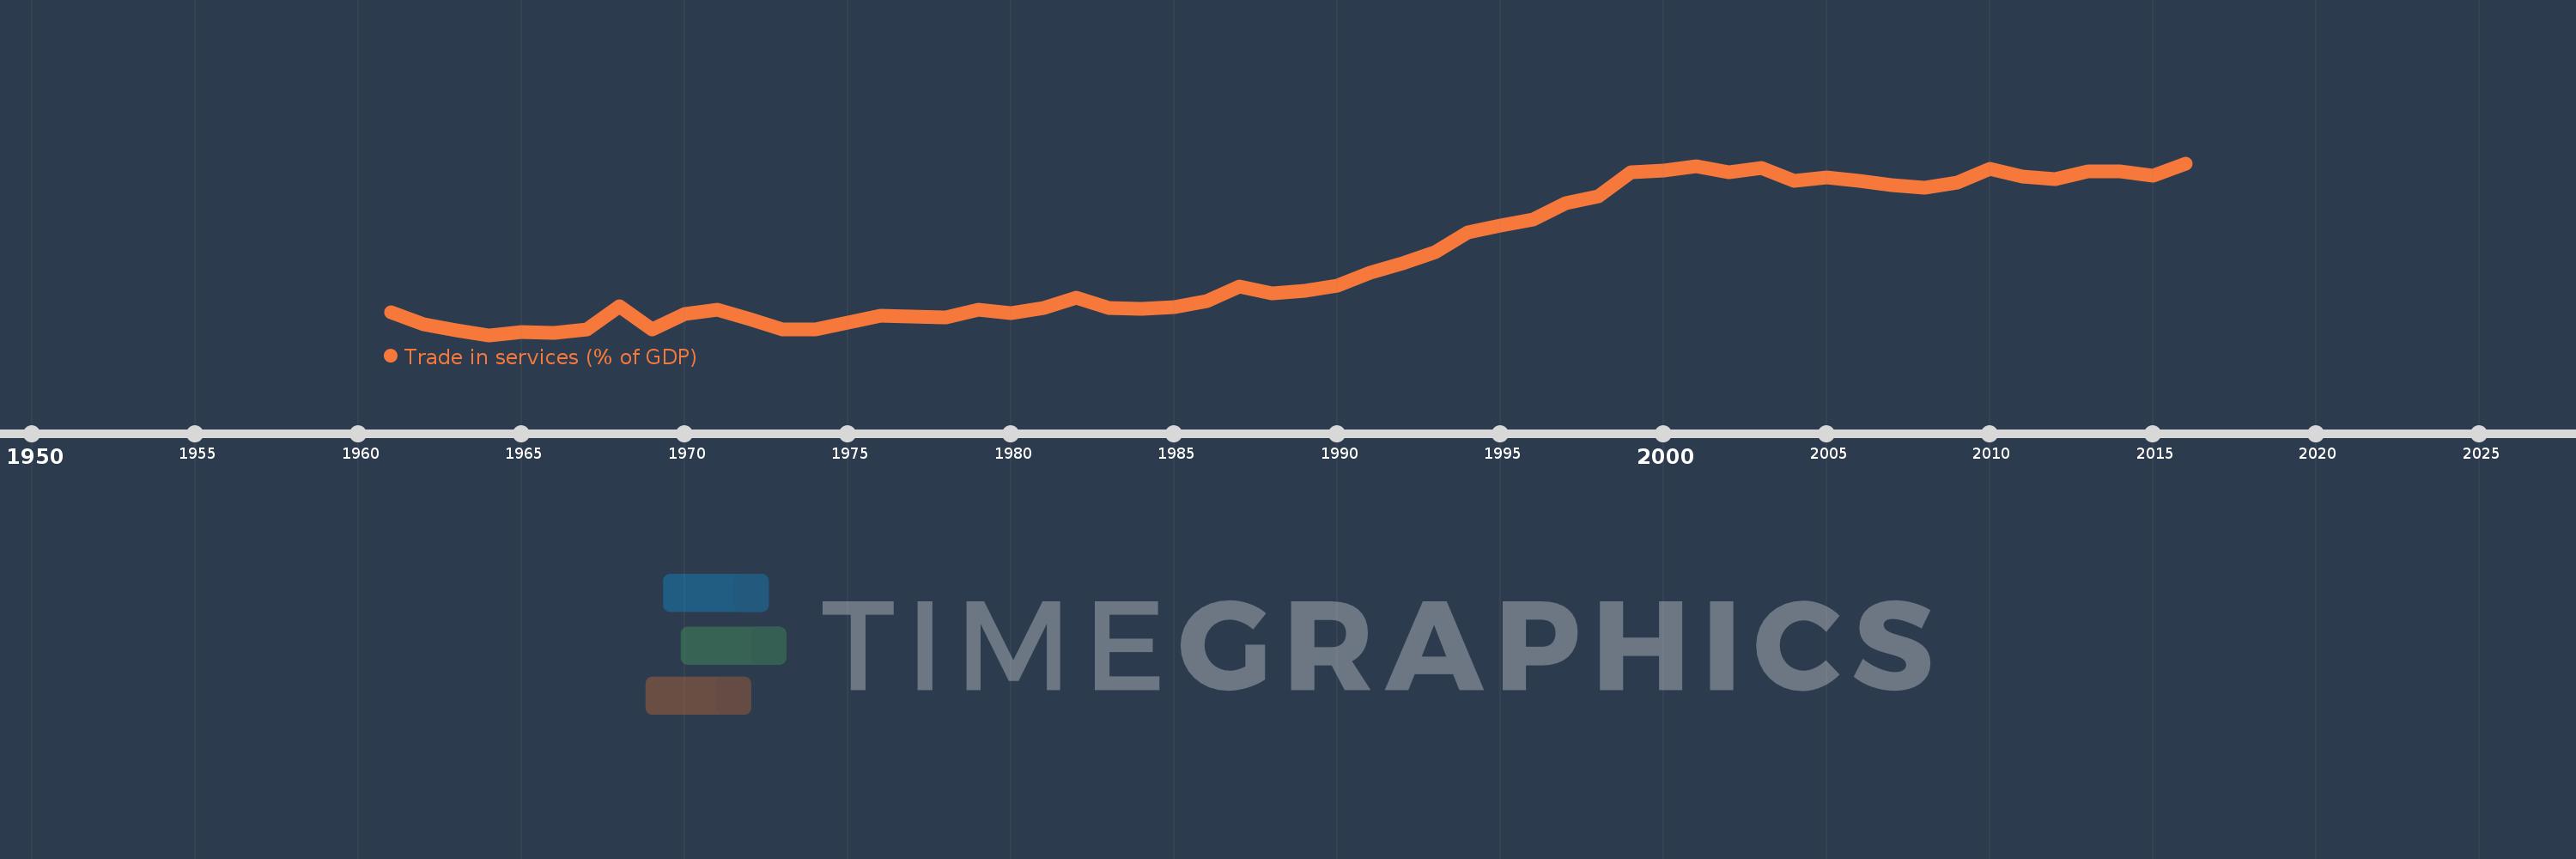
Trade in services (% of GDP)
2016,2015,2014,2013,2012,2011,2010,2009,2008,2007,2006,2005,2004,2003,2002,2001,2000,1999,1998,1997,1996,1995,1994,1993,1992,1991,1990,1989,1988,1987,1986,1985,1984,1983,1982,1981,1980,1979,1978,1977,1976,1975,1974,1973,1972,1971,1970,1969,1968,1967,1966,1965,1964,1963,1962,1961
This statistics in other country:
AfghanistanAlbaniaAlgeriaAngolaAntigua and BarbudaArab WorldArgentinaArmeniaArubaAustraliaAustriaAzerbaijanBahamas, TheBahrainBangladeshBarbadosBelarusBelgiumBelizeBeninBermudaBhutanBoliviaBosnia and HerzegovinaBotswanaBrazilBrunei DarussalamBulgariaBurkina FasoBurundiCabo VerdeCambodiaCameroonCanadaCaribbean small statesCentral African RepublicCentral Europe and the BalticsChadChileChinaColombiaComorosCongo, Dem. Rep.Congo, Rep.Costa RicaCote d'IvoireCroatiaCyprusCzech RepublicDenmarkDjiboutiDominicaDominican RepublicEarly-demographic dividendEast Asia & PacificEast Asia & Pacific (excluding high income)East Asia & Pacific (IDA & IBRD countries)EcuadorEgypt, Arab Rep.El SalvadorEquatorial GuineaEritreaEstoniaEthiopiaEuro areaEurope & Central AsiaEurope & Central Asia (excluding high income)Europe & Central Asia (IDA & IBRD countries)European UnionFaroe IslandsFijiFinlandFragile and conflict affected situationsFranceGabonGambia, TheGeorgiaGermanyGhanaGreeceGrenadaGuatemalaGuineaGuinea-BissauGuyanaHaitiHeavily indebted poor countries (HIPC)High incomeHondurasHong Kong SAR, ChinaHungaryIBRD onlyIcelandIDA & IBRD totalIDA blendIDA onlyIDA totalIndiaIndonesiaIran, Islamic Rep.IraqIrelandIsraelItalyJamaicaJapanJordanKazakhstanKenyaKiribatiKorea, Rep.KosovoKuwaitKyrgyz RepublicLao PDRLate-demographic dividendLatin America & Caribbean Latin America & Caribbean (excluding high income)Latin America & the Caribbean (IDA & IBRD countries)LatviaLeast developed countries: UN classificationLebanonLesothoLiberiaLibyaLithuaniaLow & middle incomeLow incomeLower middle incomeLuxembourgMacao SAR, ChinaMacedonia, FYRMadagascarMalawiMalaysiaMaldivesMaliMaltaMarshall IslandsMauritaniaMauritiusMexicoMicronesia, Fed. Sts.Middle East & North AfricaMiddle East & North Africa (excluding high income)Middle East & North Africa (IDA & IBRD countries)Middle incomeMoldovaMongoliaMontenegroMoroccoMozambiqueMyanmarNamibiaNepalNetherlandsNew ZealandNicaraguaNigerNigeriaNorth AmericaNorwayOECD membersOmanOther small statesPacific island small statesPakistanPalauPanamaPapua New GuineaParaguayPeruPhilippinesPolandPortugalPost-demographic dividendPre-demographic dividendQatarRomaniaRussian FederationRwandaSamoaSao Tome and PrincipeSaudi ArabiaSenegalSerbiaSeychellesSierra LeoneSingaporeSlovak RepublicSloveniaSmall statesSolomon IslandsSouth AfricaSouth AsiaSouth Asia (IDA & IBRD)South SudanSpainSri LankaSt. Kitts and NevisSt. LuciaSt. Vincent and the GrenadinesSub-Saharan Africa Sub-Saharan Africa (excluding high income)Sub-Saharan Africa (IDA & IBRD countries)SudanSurinameSwazilandSwedenSwitzerlandSyrian Arab RepublicTajikistanTanzaniaThailandTimor-LesteTogoTongaTrinidad and TobagoTunisiaTurkeyTuvaluUgandaUkraineUnited KingdomUnited StatesUpper middle incomeUruguayVanuatuVenezuela, RBVietnamWest Bank and GazaWorldYemen, Rep.ZambiaZimbabwe Timeline:
This timeline shows a graph from 1961 to 2016 of Canada. No data until 1960. Number of actual observations by date: 56.
Source name:
World Development Indicators
Source organization:
International Monetary Fund, Balance of Payments Statistics Yearbook and data files, and World Bank and OECD GDP estimates.
Categories, topics:
Economy & Growth, Private Sector, Trade
Last updated:
apr 23, 2017
Indicators value changes by year
At the date of observation
Value
Absolute change
Change from previous value
jan 1, 1961
6.501
+6.501
0.0%
jan 1, 1962
6.088
-0.412
-6.35%
jan 1, 1963
5.898
-0.19
-3.12%
jan 1, 1964
5.755
-0.143
-2.43%
jan 1, 1965
5.847
+0.092
1.6%
jan 1, 1966
5.814
-0.034
-0.57%
jan 1, 1967
5.939
+0.125
2.15%
jan 1, 1968
6.669
+0.73
12.3%
jan 1, 1969
5.93
-0.739
-11.09%
jan 1, 1970
6.436
+0.506
8.53%
jan 1, 1971
6.573
+0.138
2.14%
jan 1, 1972
6.278
-0.295
-4.49%
jan 1, 1973
5.937
-0.342
-5.44%
jan 1, 1974
5.948
+0.011
0.19%
jan 1, 1975
6.17
+0.222
3.74%
jan 1, 1976
6.391
+0.221
3.58%
jan 1, 1977
6.343
-0.048
-0.75%
jan 1, 1978
6.336
-0.007
-0.11%
jan 1, 1979
6.558
+0.222
3.5%
jan 1, 1980
6.47
-0.088
-1.34%
jan 1, 1981
6.613
+0.143
2.21%
jan 1, 1982
6.959
+0.346
5.23%
jan 1, 1983
6.633
-0.326
-4.69%
jan 1, 1984
6.61
-0.023
-0.35%
jan 1, 1985
6.666
+0.057
0.86%
jan 1, 1986
6.857
+0.191
2.86%
jan 1, 1987
7.313
+0.456
6.65%
jan 1, 1988
7.088
-0.226
-3.09%
jan 1, 1989
7.176
+0.089
1.25%
jan 1, 1990
7.346
+0.17
2.37%
jan 1, 1991
7.758
+0.411
5.6%
jan 1, 1992
8.058
+0.301
3.88%
jan 1, 1993
8.425
+0.367
4.55%
jan 1, 1994
9.053
+0.628
7.45%
jan 1, 1995
9.276
+0.223
2.47%
jan 1, 1996
9.471
+0.195
2.1%
jan 1, 1997
10.008
+0.536
5.66%
jan 1, 1998
10.218
+0.211
2.1%
jan 1, 1999
11.012
+0.794
7.77%
jan 1, 2000
11.052
+0.04
0.36%
jan 1, 2001
11.204
+0.152
1.38%
jan 1, 2002
11.013
-0.192
-1.71%
jan 1, 2003
11.137
+0.124
1.13%
jan 1, 2004
10.723
-0.414
-3.71%
jan 1, 2005
10.834
+0.11
1.03%
jan 1, 2006
10.728
-0.106
-0.98%
jan 1, 2007
10.591
-0.137
-1.28%
jan 1, 2008
10.493
-0.099
-0.93%
jan 1, 2009
10.679
+0.186
1.77%
jan 1, 2010
11.099
+0.421
3.94%
jan 1, 2011
10.869
-0.23
-2.07%
jan 1, 2012
10.773
-0.096
-0.89%
jan 1, 2013
11.03
+0.258
2.39%
jan 1, 2014
11.036
+0.005
0.05%
jan 1, 2015
10.899
-0.137
-1.24%
jan 1, 2016
11.29
+0.391
3.59%
Ranking of countries by current statistics by years


Comments: