29
/
en
AIzaSyAYiBZKx7MnpbEhh9jyipgxe19OcubqV5w
April 1, 2024
207541
Nepal
NPL
true
2
1
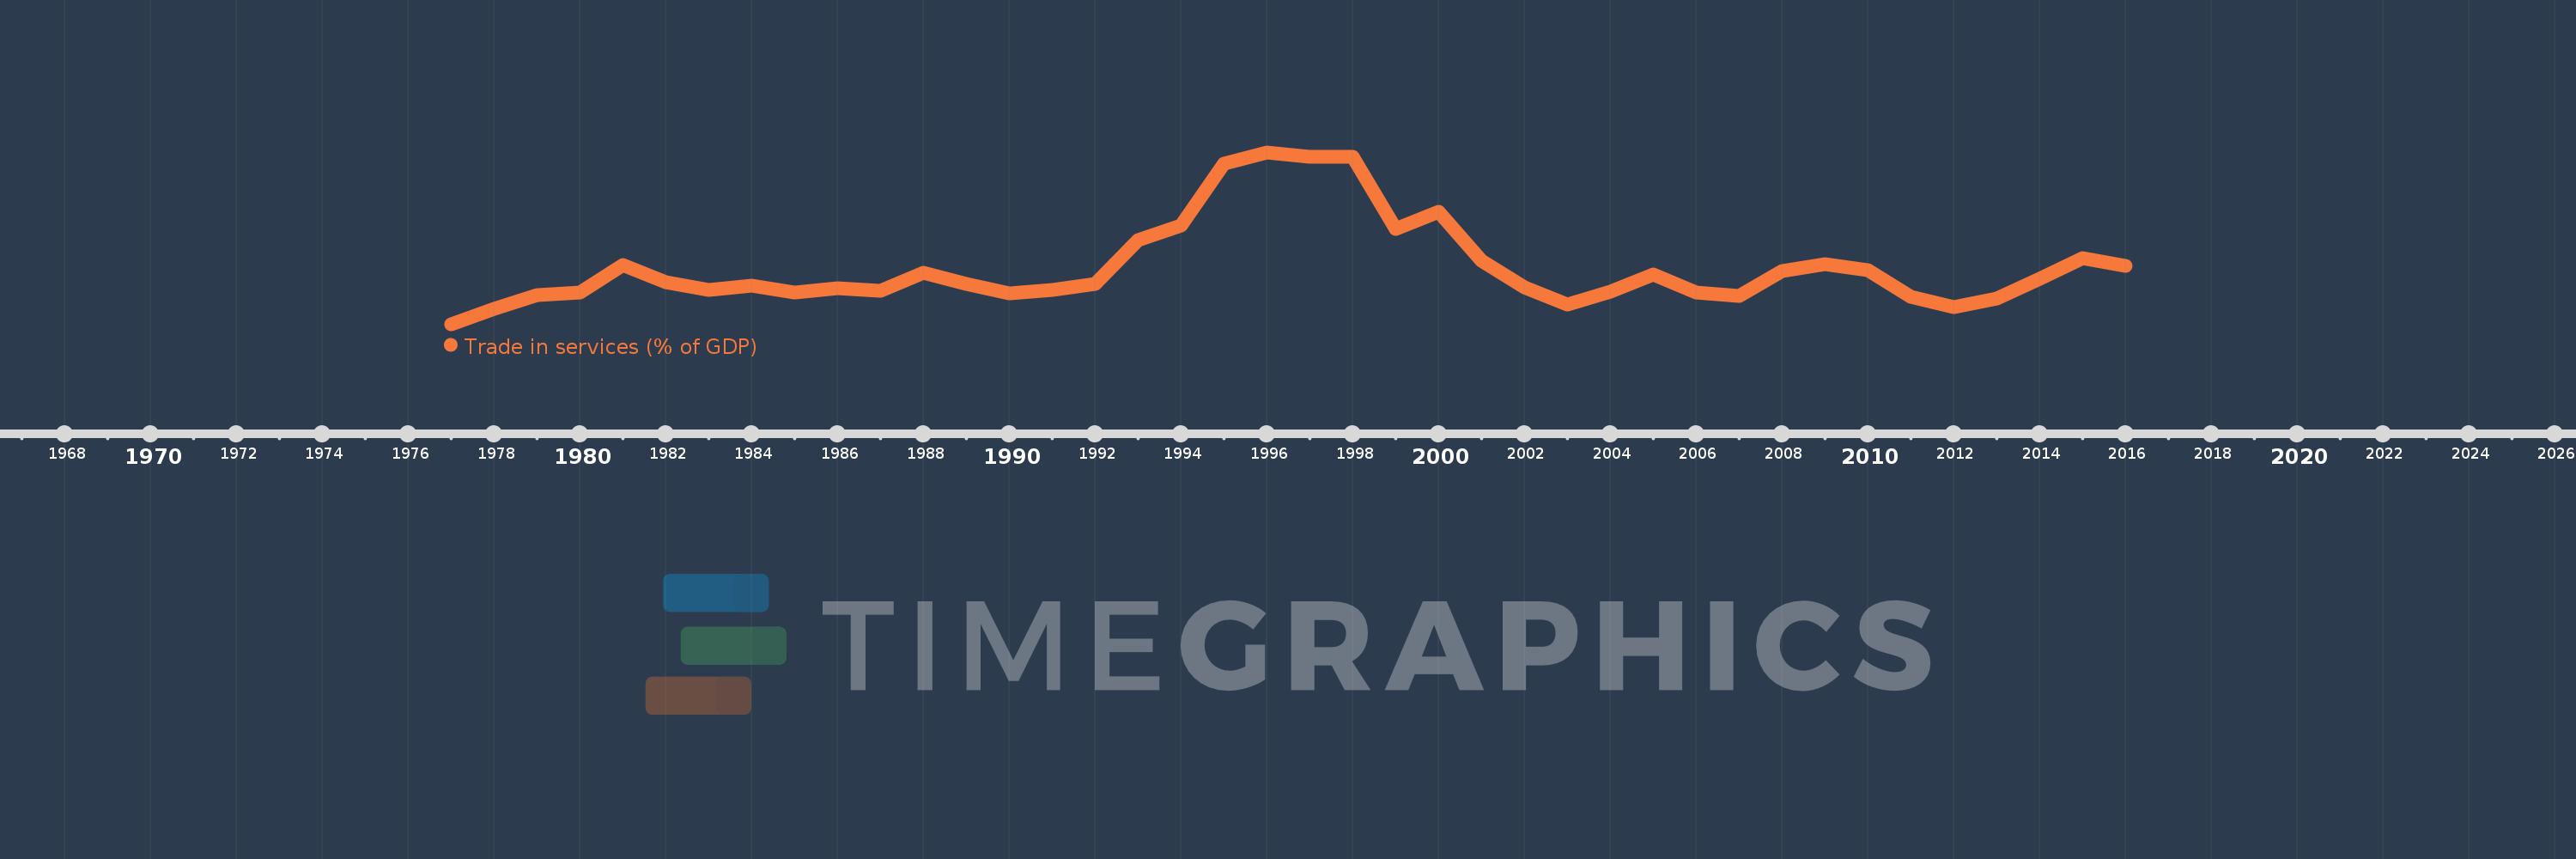
Trade in services (% of GDP)
2016,2015,2014,2013,2012,2011,2010,2009,2008,2007,2006,2005,2004,2003,2002,2001,2000,1999,1998,1997,1996,1995,1994,1993,1992,1991,1990,1989,1988,1987,1986,1985,1984,1983,1982,1981,1980,1979,1978,1977
This statistics in other country:
AfghanistanAlbaniaAlgeriaAngolaAntigua and BarbudaArab WorldArgentinaArmeniaArubaAustraliaAustriaAzerbaijanBahamas, TheBahrainBangladeshBarbadosBelarusBelgiumBelizeBeninBermudaBhutanBoliviaBosnia and HerzegovinaBotswanaBrazilBrunei DarussalamBulgariaBurkina FasoBurundiCabo VerdeCambodiaCameroonCanadaCaribbean small statesCentral African RepublicCentral Europe and the BalticsChadChileChinaColombiaComorosCongo, Dem. Rep.Congo, Rep.Costa RicaCote d'IvoireCroatiaCyprusCzech RepublicDenmarkDjiboutiDominicaDominican RepublicEarly-demographic dividendEast Asia & PacificEast Asia & Pacific (excluding high income)East Asia & Pacific (IDA & IBRD countries)EcuadorEgypt, Arab Rep.El SalvadorEquatorial GuineaEritreaEstoniaEthiopiaEuro areaEurope & Central AsiaEurope & Central Asia (excluding high income)Europe & Central Asia (IDA & IBRD countries)European UnionFaroe IslandsFijiFinlandFragile and conflict affected situationsFranceGabonGambia, TheGeorgiaGermanyGhanaGreeceGrenadaGuatemalaGuineaGuinea-BissauGuyanaHaitiHeavily indebted poor countries (HIPC)High incomeHondurasHong Kong SAR, ChinaHungaryIBRD onlyIcelandIDA & IBRD totalIDA blendIDA onlyIDA totalIndiaIndonesiaIran, Islamic Rep.IraqIrelandIsraelItalyJamaicaJapanJordanKazakhstanKenyaKiribatiKorea, Rep.KosovoKuwaitKyrgyz RepublicLao PDRLate-demographic dividendLatin America & Caribbean Latin America & Caribbean (excluding high income)Latin America & the Caribbean (IDA & IBRD countries)LatviaLeast developed countries: UN classificationLebanonLesothoLiberiaLibyaLithuaniaLow & middle incomeLow incomeLower middle incomeLuxembourgMacao SAR, ChinaMacedonia, FYRMadagascarMalawiMalaysiaMaldivesMaliMaltaMarshall IslandsMauritaniaMauritiusMexicoMicronesia, Fed. Sts.Middle East & North AfricaMiddle East & North Africa (excluding high income)Middle East & North Africa (IDA & IBRD countries)Middle incomeMoldovaMongoliaMontenegroMoroccoMozambiqueMyanmarNamibiaNepalNetherlandsNew ZealandNicaraguaNigerNigeriaNorth AmericaNorwayOECD membersOmanOther small statesPacific island small statesPakistanPalauPanamaPapua New GuineaParaguayPeruPhilippinesPolandPortugalPost-demographic dividendPre-demographic dividendQatarRomaniaRussian FederationRwandaSamoaSao Tome and PrincipeSaudi ArabiaSenegalSerbiaSeychellesSierra LeoneSingaporeSlovak RepublicSloveniaSmall statesSolomon IslandsSouth AfricaSouth AsiaSouth Asia (IDA & IBRD)South SudanSpainSri LankaSt. Kitts and NevisSt. LuciaSt. Vincent and the GrenadinesSub-Saharan Africa Sub-Saharan Africa (excluding high income)Sub-Saharan Africa (IDA & IBRD countries)SudanSurinameSwazilandSwedenSwitzerlandSyrian Arab RepublicTajikistanTanzaniaThailandTimor-LesteTogoTongaTrinidad and TobagoTunisiaTurkeyTuvaluUgandaUkraineUnited KingdomUnited StatesUpper middle incomeUruguayVanuatuVenezuela, RBVietnamWest Bank and GazaWorldYemen, Rep.ZambiaZimbabwe Timeline:
This timeline shows a graph from 1977 to 2016 of Nepal. No data until 1976. Number of actual observations by date: 40.
Source name:
World Development Indicators
Source organization:
International Monetary Fund, Balance of Payments Statistics Yearbook and data files, and World Bank and OECD GDP estimates.
Categories, topics:
Economy & Growth, Private Sector, Trade
Last updated:
apr 23, 2017
Indicators value changes by year
Maximum:
22.547
jan 1, 1996
At the date of observation
Value
Absolute change
Change from previous value
jan 1, 1977
7.169
+7.169
0.0%
jan 1, 1978
8.555
+1.386
19.33%
jan 1, 1979
9.742
+1.187
13.88%
jan 1, 1980
10.034
+0.292
3.0%
jan 1, 1981
12.473
+2.439
24.31%
jan 1, 1982
10.962
-1.511
-12.12%
jan 1, 1983
10.241
-0.72
-6.57%
jan 1, 1984
10.584
+0.343
3.35%
jan 1, 1985
10.023
-0.562
-5.31%
jan 1, 1986
10.424
+0.401
4.0%
jan 1, 1987
10.183
-0.241
-2.31%
jan 1, 1988
11.799
+1.616
15.87%
jan 1, 1989
10.743
-1.056
-8.95%
jan 1, 1990
9.952
-0.792
-7.37%
jan 1, 1991
10.247
+0.295
2.96%
jan 1, 1992
10.807
+0.56
5.47%
jan 1, 1993
14.666
+3.859
35.7%
jan 1, 1994
15.984
+1.319
8.99%
jan 1, 1995
21.537
+5.552
34.74%
jan 1, 1996
22.547
+1.01
4.69%
jan 1, 1997
22.122
-0.425
-1.88%
jan 1, 1998
22.165
+0.043
0.19%
jan 1, 1999
15.677
-6.488
-29.27%
jan 1, 2000
17.235
+1.558
9.94%
jan 1, 2001
12.848
-4.387
-25.46%
jan 1, 2002
10.455
-2.393
-18.63%
jan 1, 2003
8.957
-1.497
-14.32%
jan 1, 2004
10.083
+1.126
12.57%
jan 1, 2005
11.629
+1.546
15.33%
jan 1, 2006
10.025
-1.604
-13.79%
jan 1, 2007
9.714
-0.311
-3.1%
jan 1, 2008
11.95
+2.236
23.01%
jan 1, 2009
12.558
+0.608
5.08%
jan 1, 2010
12.03
-0.527
-4.2%
jan 1, 2011
9.627
-2.403
-19.97%
jan 1, 2012
8.73
-0.897
-9.32%
jan 1, 2013
9.482
+0.752
8.61%
jan 1, 2014
11.211
+1.729
18.23%
jan 1, 2015
13.051
+1.84
16.41%
jan 1, 2016
12.415
-0.636
-4.87%
Ranking of countries by current statistics by years


Comments: