29
/
en
AIzaSyAYiBZKx7MnpbEhh9jyipgxe19OcubqV5w
April 1, 2024
30363
Euro area
EMU
false
2
1
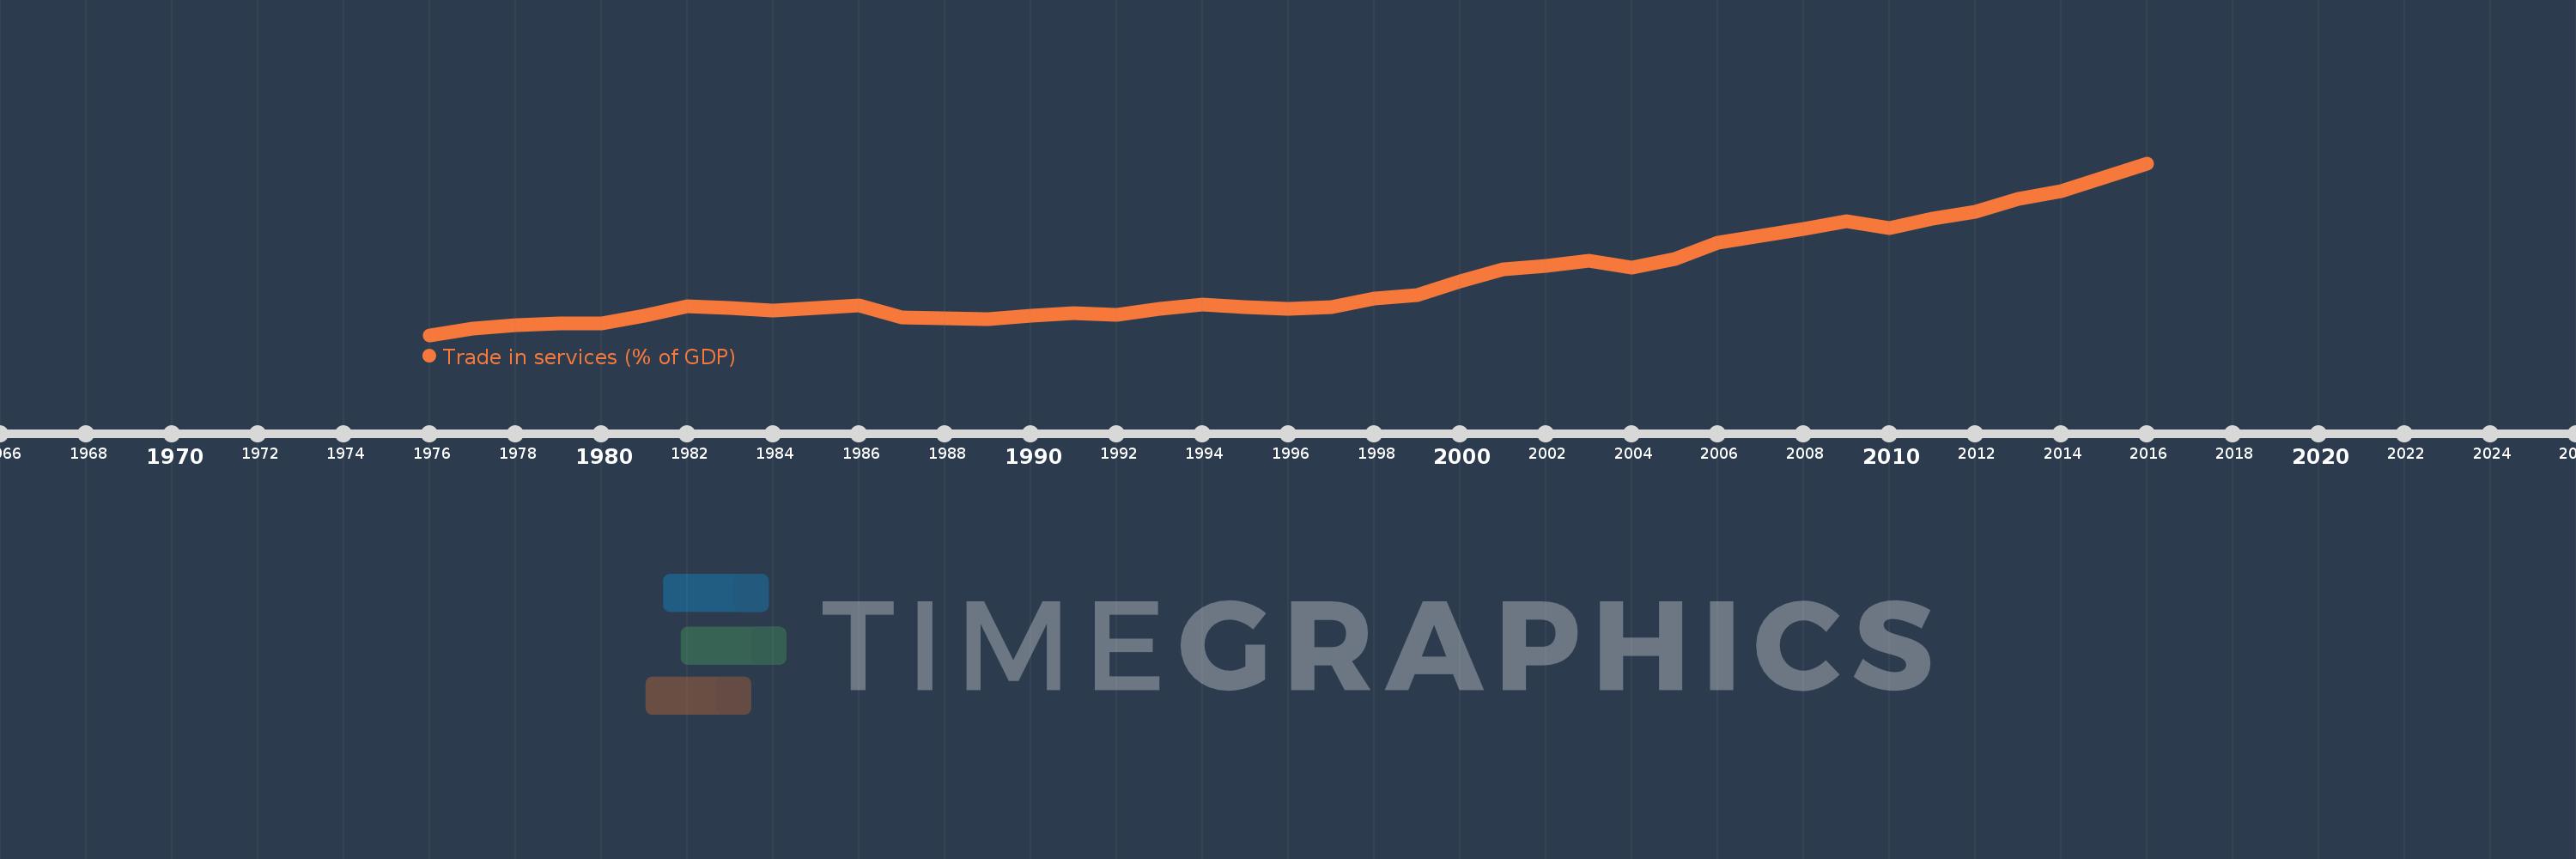
Trade in services (% of GDP)
2016,2015,2014,2013,2012,2011,2010,2009,2008,2007,2006,2005,2004,2003,2002,2001,2000,1999,1998,1997,1996,1995,1994,1993,1992,1991,1990,1989,1988,1987,1986,1985,1984,1983,1982,1981,1980,1979,1978,1977,1976
This statistics in other country:
AfghanistanAlbaniaAlgeriaAngolaAntigua and BarbudaArab WorldArgentinaArmeniaArubaAustraliaAustriaAzerbaijanBahamas, TheBahrainBangladeshBarbadosBelarusBelgiumBelizeBeninBermudaBhutanBoliviaBosnia and HerzegovinaBotswanaBrazilBrunei DarussalamBulgariaBurkina FasoBurundiCabo VerdeCambodiaCameroonCanadaCaribbean small statesCentral African RepublicCentral Europe and the BalticsChadChileChinaColombiaComorosCongo, Dem. Rep.Congo, Rep.Costa RicaCote d'IvoireCroatiaCyprusCzech RepublicDenmarkDjiboutiDominicaDominican RepublicEarly-demographic dividendEast Asia & PacificEast Asia & Pacific (excluding high income)East Asia & Pacific (IDA & IBRD countries)EcuadorEgypt, Arab Rep.El SalvadorEquatorial GuineaEritreaEstoniaEthiopiaEuro areaEurope & Central AsiaEurope & Central Asia (excluding high income)Europe & Central Asia (IDA & IBRD countries)European UnionFaroe IslandsFijiFinlandFragile and conflict affected situationsFranceGabonGambia, TheGeorgiaGermanyGhanaGreeceGrenadaGuatemalaGuineaGuinea-BissauGuyanaHaitiHeavily indebted poor countries (HIPC)High incomeHondurasHong Kong SAR, ChinaHungaryIBRD onlyIcelandIDA & IBRD totalIDA blendIDA onlyIDA totalIndiaIndonesiaIran, Islamic Rep.IraqIrelandIsraelItalyJamaicaJapanJordanKazakhstanKenyaKiribatiKorea, Rep.KosovoKuwaitKyrgyz RepublicLao PDRLate-demographic dividendLatin America & Caribbean Latin America & Caribbean (excluding high income)Latin America & the Caribbean (IDA & IBRD countries)LatviaLeast developed countries: UN classificationLebanonLesothoLiberiaLibyaLithuaniaLow & middle incomeLow incomeLower middle incomeLuxembourgMacao SAR, ChinaMacedonia, FYRMadagascarMalawiMalaysiaMaldivesMaliMaltaMarshall IslandsMauritaniaMauritiusMexicoMicronesia, Fed. Sts.Middle East & North AfricaMiddle East & North Africa (excluding high income)Middle East & North Africa (IDA & IBRD countries)Middle incomeMoldovaMongoliaMontenegroMoroccoMozambiqueMyanmarNamibiaNepalNetherlandsNew ZealandNicaraguaNigerNigeriaNorth AmericaNorwayOECD membersOmanOther small statesPacific island small statesPakistanPalauPanamaPapua New GuineaParaguayPeruPhilippinesPolandPortugalPost-demographic dividendPre-demographic dividendQatarRomaniaRussian FederationRwandaSamoaSao Tome and PrincipeSaudi ArabiaSenegalSerbiaSeychellesSierra LeoneSingaporeSlovak RepublicSloveniaSmall statesSolomon IslandsSouth AfricaSouth AsiaSouth Asia (IDA & IBRD)South SudanSpainSri LankaSt. Kitts and NevisSt. LuciaSt. Vincent and the GrenadinesSub-Saharan Africa Sub-Saharan Africa (excluding high income)Sub-Saharan Africa (IDA & IBRD countries)SudanSurinameSwazilandSwedenSwitzerlandSyrian Arab RepublicTajikistanTanzaniaThailandTimor-LesteTogoTongaTrinidad and TobagoTunisiaTurkeyTuvaluUgandaUkraineUnited KingdomUnited StatesUpper middle incomeUruguayVanuatuVenezuela, RBVietnamWest Bank and GazaWorldYemen, Rep.ZambiaZimbabwe Timeline:
This timeline shows a graph from 1976 to 2016 of Euro area. No data until 1975. Number of actual observations by date: 41.
Source name:
World Development Indicators
Source organization:
International Monetary Fund, Balance of Payments Statistics Yearbook and data files, and World Bank and OECD GDP estimates.
Categories, topics:
Economy & Growth, Private Sector, Trade
Last updated:
apr 23, 2017
Indicators value changes by year
Maximum:
23.496
jan 1, 2016
At the date of observation
Value
Absolute change
Change from previous value
jan 1, 1976
8.009
+8.009
0.0%
jan 1, 1977
8.614
+0.605
7.55%
jan 1, 1978
8.893
+0.279
3.24%
jan 1, 1979
9.034
+0.141
1.58%
jan 1, 1980
9.063
+0.029
0.32%
jan 1, 1981
9.783
+0.72
7.95%
jan 1, 1982
10.585
+0.801
8.19%
jan 1, 1983
10.47
-0.115
-1.09%
jan 1, 1984
10.214
-0.256
-2.44%
jan 1, 1985
10.447
+0.233
2.29%
jan 1, 1986
10.65
+0.203
1.94%
jan 1, 1987
9.629
-1.021
-9.59%
jan 1, 1988
9.493
-0.136
-1.41%
jan 1, 1989
9.419
-0.074
-0.78%
jan 1, 1990
9.73
+0.311
3.3%
jan 1, 1991
9.966
+0.235
2.42%
jan 1, 1992
9.84
-0.125
-1.26%
jan 1, 1993
10.367
+0.527
5.36%
jan 1, 1994
10.764
+0.397
3.83%
jan 1, 1995
10.512
-0.253
-2.35%
jan 1, 1996
10.408
-0.104
-0.99%
jan 1, 1997
10.519
+0.111
1.06%
jan 1, 1998
11.283
+0.764
7.27%
jan 1, 1999
11.641
+0.358
3.17%
jan 1, 2000
12.878
+1.237
10.63%
jan 1, 2001
13.959
+1.081
8.39%
jan 1, 2002
14.223
+0.265
1.9%
jan 1, 2003
14.741
+0.517
3.64%
jan 1, 2004
14.096
-0.645
-4.38%
jan 1, 2005
14.832
+0.737
5.23%
jan 1, 2006
16.347
+1.515
10.21%
jan 1, 2007
16.988
+0.641
3.92%
jan 1, 2008
17.586
+0.598
3.52%
jan 1, 2009
18.293
+0.707
4.02%
jan 1, 2010
17.681
-0.612
-3.35%
jan 1, 2011
18.503
+0.822
4.65%
jan 1, 2012
19.142
+0.639
3.46%
jan 1, 2013
20.266
+1.123
5.87%
jan 1, 2014
21.012
+0.747
3.68%
jan 1, 2015
22.24
+1.228
5.84%
jan 1, 2016
23.496
+1.256
5.65%
Ranking of countries by current statistics by years


Comments: