29
/
en
AIzaSyAYiBZKx7MnpbEhh9jyipgxe19OcubqV5w
April 1, 2024
253762
Sudan
SDN
true
2
1
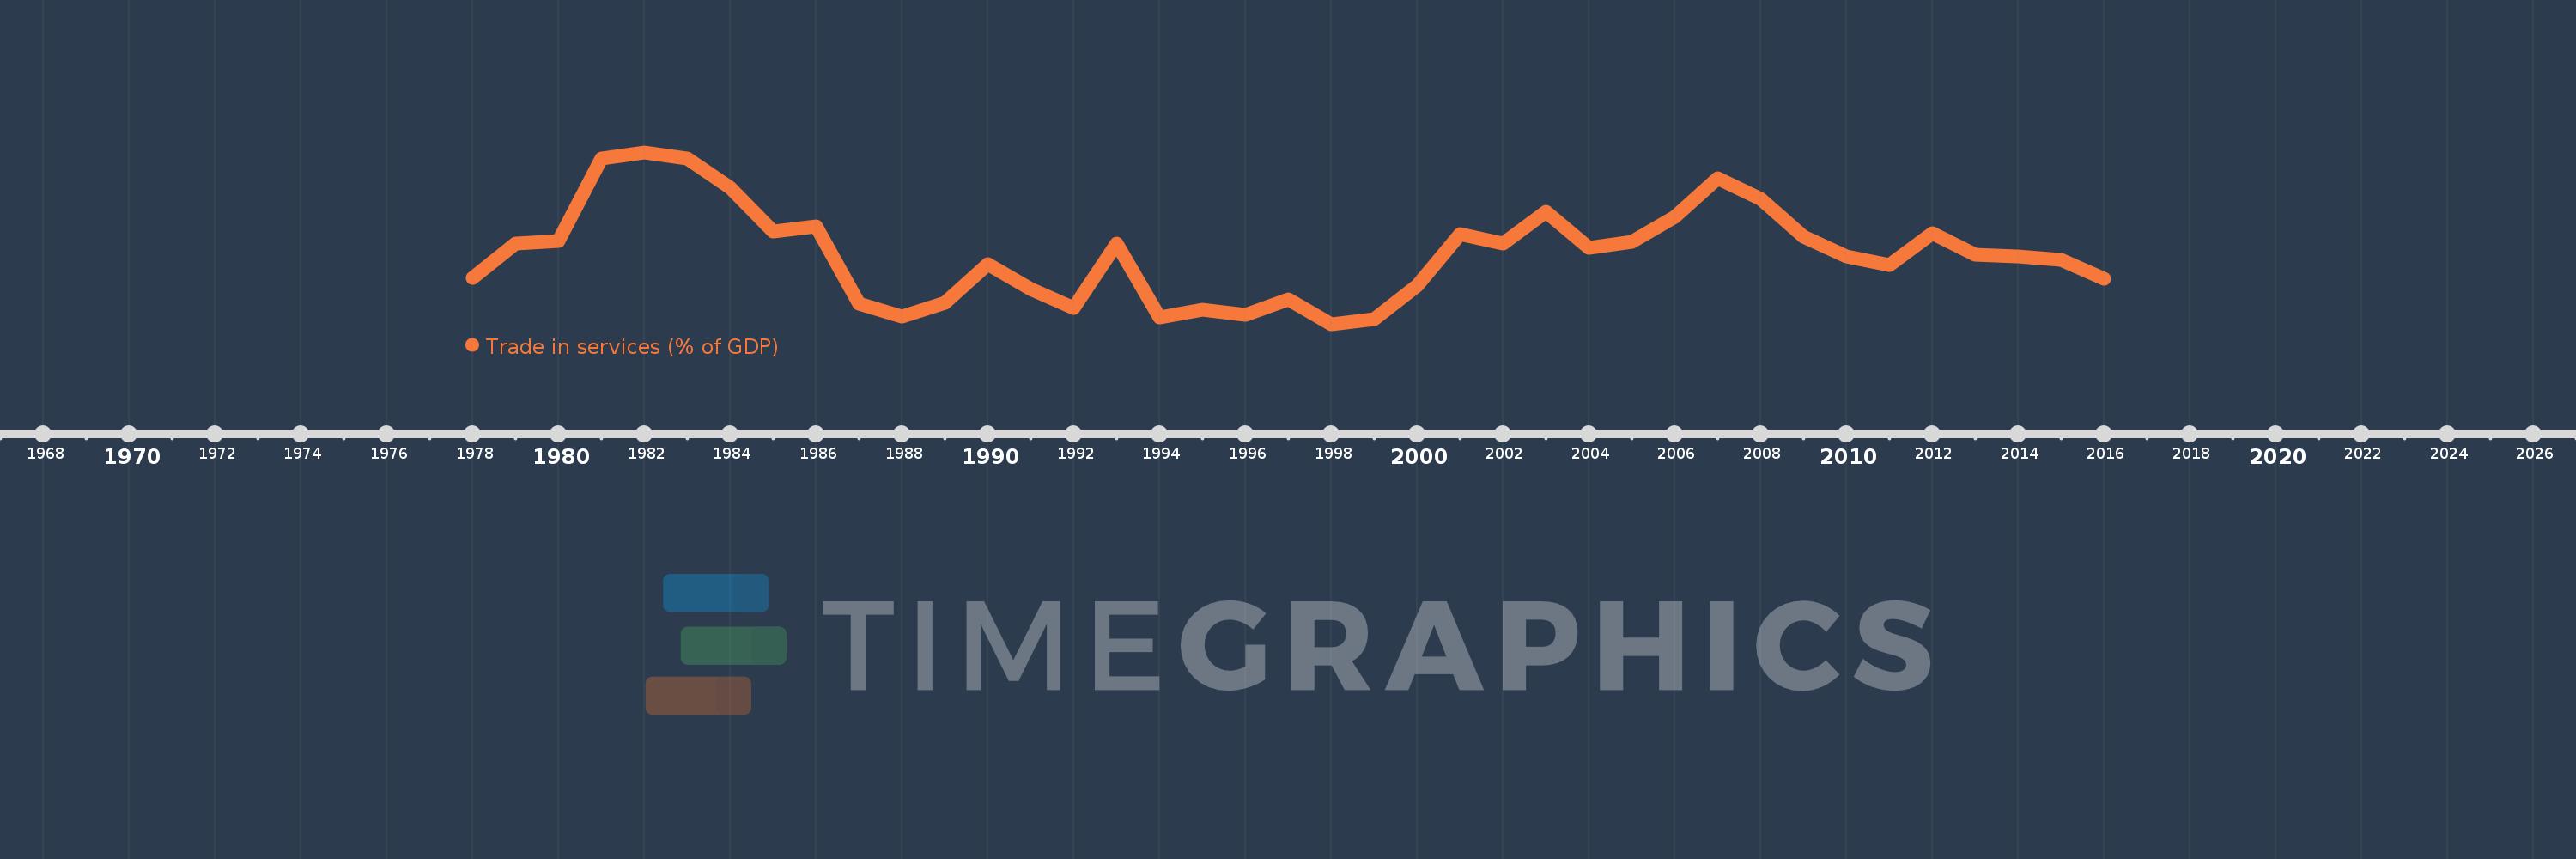
Trade in services (% of GDP)
2016,2015,2014,2013,2012,2011,2010,2009,2008,2007,2006,2005,2004,2003,2002,2001,2000,1999,1998,1997,1996,1995,1994,1993,1992,1991,1990,1989,1988,1987,1986,1985,1984,1983,1982,1981,1980,1979,1978
This statistics in other country:
AfghanistanAlbaniaAlgeriaAngolaAntigua and BarbudaArab WorldArgentinaArmeniaArubaAustraliaAustriaAzerbaijanBahamas, TheBahrainBangladeshBarbadosBelarusBelgiumBelizeBeninBermudaBhutanBoliviaBosnia and HerzegovinaBotswanaBrazilBrunei DarussalamBulgariaBurkina FasoBurundiCabo VerdeCambodiaCameroonCanadaCaribbean small statesCentral African RepublicCentral Europe and the BalticsChadChileChinaColombiaComorosCongo, Dem. Rep.Congo, Rep.Costa RicaCote d'IvoireCroatiaCyprusCzech RepublicDenmarkDjiboutiDominicaDominican RepublicEarly-demographic dividendEast Asia & PacificEast Asia & Pacific (excluding high income)East Asia & Pacific (IDA & IBRD countries)EcuadorEgypt, Arab Rep.El SalvadorEquatorial GuineaEritreaEstoniaEthiopiaEuro areaEurope & Central AsiaEurope & Central Asia (excluding high income)Europe & Central Asia (IDA & IBRD countries)European UnionFaroe IslandsFijiFinlandFragile and conflict affected situationsFranceGabonGambia, TheGeorgiaGermanyGhanaGreeceGrenadaGuatemalaGuineaGuinea-BissauGuyanaHaitiHeavily indebted poor countries (HIPC)High incomeHondurasHong Kong SAR, ChinaHungaryIBRD onlyIcelandIDA & IBRD totalIDA blendIDA onlyIDA totalIndiaIndonesiaIran, Islamic Rep.IraqIrelandIsraelItalyJamaicaJapanJordanKazakhstanKenyaKiribatiKorea, Rep.KosovoKuwaitKyrgyz RepublicLao PDRLate-demographic dividendLatin America & Caribbean Latin America & Caribbean (excluding high income)Latin America & the Caribbean (IDA & IBRD countries)LatviaLeast developed countries: UN classificationLebanonLesothoLiberiaLibyaLithuaniaLow & middle incomeLow incomeLower middle incomeLuxembourgMacao SAR, ChinaMacedonia, FYRMadagascarMalawiMalaysiaMaldivesMaliMaltaMarshall IslandsMauritaniaMauritiusMexicoMicronesia, Fed. Sts.Middle East & North AfricaMiddle East & North Africa (excluding high income)Middle East & North Africa (IDA & IBRD countries)Middle incomeMoldovaMongoliaMontenegroMoroccoMozambiqueMyanmarNamibiaNepalNetherlandsNew ZealandNicaraguaNigerNigeriaNorth AmericaNorwayOECD membersOmanOther small statesPacific island small statesPakistanPalauPanamaPapua New GuineaParaguayPeruPhilippinesPolandPortugalPost-demographic dividendPre-demographic dividendQatarRomaniaRussian FederationRwandaSamoaSao Tome and PrincipeSaudi ArabiaSenegalSerbiaSeychellesSierra LeoneSingaporeSlovak RepublicSloveniaSmall statesSolomon IslandsSouth AfricaSouth AsiaSouth Asia (IDA & IBRD)South SudanSpainSri LankaSt. Kitts and NevisSt. LuciaSt. Vincent and the GrenadinesSub-Saharan Africa Sub-Saharan Africa (excluding high income)Sub-Saharan Africa (IDA & IBRD countries)SudanSurinameSwazilandSwedenSwitzerlandSyrian Arab RepublicTajikistanTanzaniaThailandTimor-LesteTogoTongaTrinidad and TobagoTunisiaTurkeyTuvaluUgandaUkraineUnited KingdomUnited StatesUpper middle incomeUruguayVanuatuVenezuela, RBVietnamWest Bank and GazaWorldYemen, Rep.ZambiaZimbabwe Timeline:
This timeline shows a graph from 1978 to 2016 of Sudan. No data until 1977. Number of actual observations by date: 39.
Source name:
World Development Indicators
Source organization:
International Monetary Fund, Balance of Payments Statistics Yearbook and data files, and World Bank and OECD GDP estimates.
Categories, topics:
Economy & Growth, Private Sector, Trade
Last updated:
apr 23, 2017
Indicators value changes by year
At the date of observation
Value
Absolute change
Change from previous value
jan 1, 1978
3.679
+3.679
0.0%
jan 1, 1979
5.115
+1.436
39.04%
jan 1, 1980
5.229
+0.114
2.22%
jan 1, 1981
8.652
+3.423
65.46%
jan 1, 1982
8.902
+0.25
2.89%
jan 1, 1983
8.662
-0.239
-2.69%
jan 1, 1984
7.447
-1.215
-14.03%
jan 1, 1985
5.598
-1.849
-24.83%
jan 1, 1986
5.809
+0.211
3.77%
jan 1, 1987
2.591
-3.218
-55.4%
jan 1, 1988
2.051
-0.54
-20.85%
jan 1, 1989
2.639
+0.588
28.68%
jan 1, 1990
4.256
+1.617
61.3%
jan 1, 1991
3.228
-1.029
-24.17%
jan 1, 1992
2.411
-0.817
-25.31%
jan 1, 1993
5.112
+2.702
112.08%
jan 1, 1994
2.018
-3.094
-60.53%
jan 1, 1995
2.344
+0.326
16.17%
jan 1, 1996
2.152
-0.192
-8.2%
jan 1, 1997
2.788
+0.637
29.58%
jan 1, 1998
1.749
-1.04
-37.28%
jan 1, 1999
1.954
+0.205
11.71%
jan 1, 2000
3.337
+1.384
70.82%
jan 1, 2001
5.507
+2.169
65.01%
jan 1, 2002
5.119
-0.387
-7.03%
jan 1, 2003
6.42
+1.3
25.4%
jan 1, 2004
4.912
-1.508
-23.49%
jan 1, 2005
5.167
+0.255
5.19%
jan 1, 2006
6.221
+1.054
20.4%
jan 1, 2007
7.815
+1.595
25.64%
jan 1, 2008
6.954
-0.862
-11.03%
jan 1, 2009
5.409
-1.545
-22.22%
jan 1, 2010
4.562
-0.846
-15.65%
jan 1, 2011
4.228
-0.335
-7.34%
jan 1, 2012
5.544
+1.317
31.14%
jan 1, 2013
4.65
-0.895
-16.13%
jan 1, 2014
4.562
-0.088
-1.88%
jan 1, 2015
4.434
-0.128
-2.8%
jan 1, 2016
3.644
-0.79
-17.81%
Ranking of countries by current statistics by years


Comments: