29
/
en
AIzaSyAYiBZKx7MnpbEhh9jyipgxe19OcubqV5w
April 1, 2024
41141
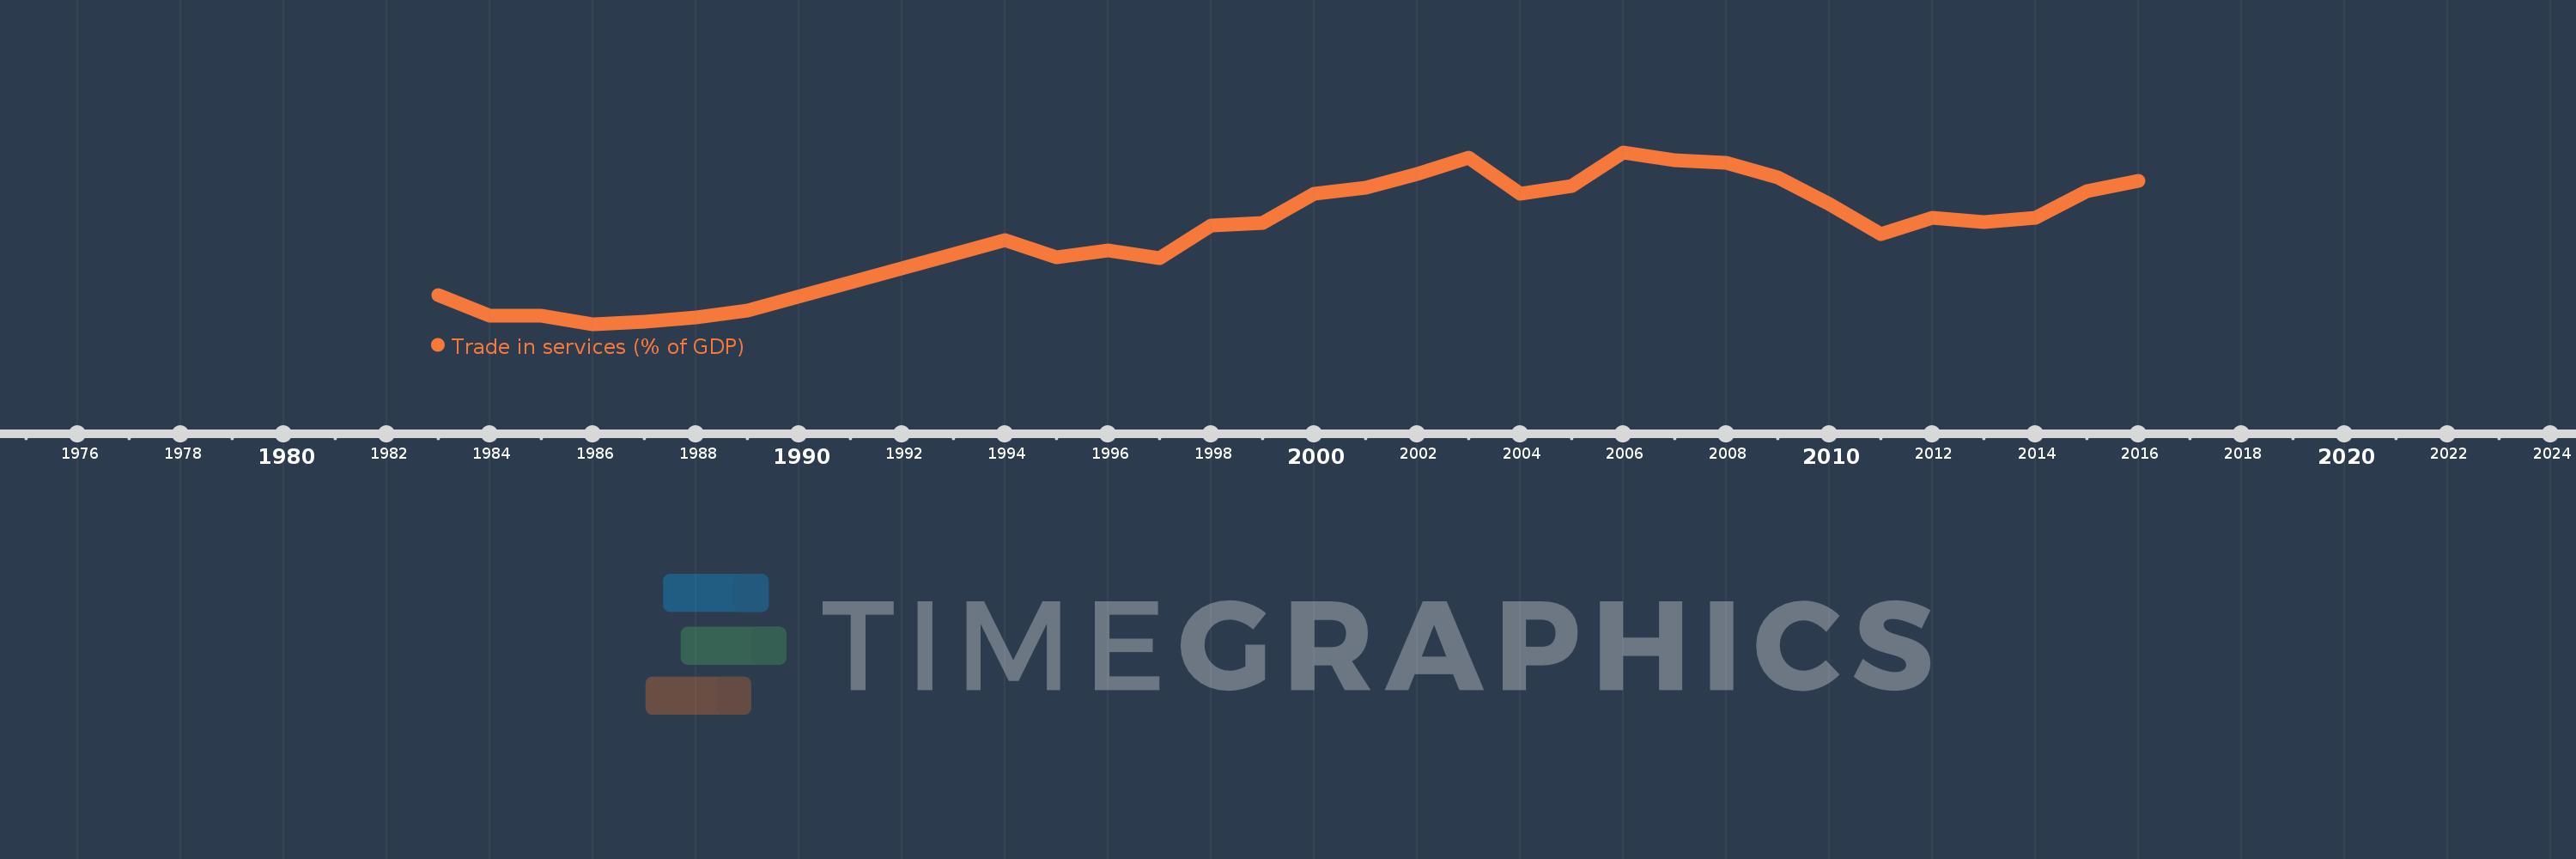
Late-demographic dividend
LTE
false
2
1
Trade in services (% of GDP)
2016,2015,2014,2013,2012,2011,2010,2009,2008,2007,2006,2005,2004,2003,2002,2001,2000,1999,1998,1997,1996,1995,1994,1989,1988,1987,1986,1985,1984,1983
This statistics in other country:
AfghanistanAlbaniaAlgeriaAngolaAntigua and BarbudaArab WorldArgentinaArmeniaArubaAustraliaAustriaAzerbaijanBahamas, TheBahrainBangladeshBarbadosBelarusBelgiumBelizeBeninBermudaBhutanBoliviaBosnia and HerzegovinaBotswanaBrazilBrunei DarussalamBulgariaBurkina FasoBurundiCabo VerdeCambodiaCameroonCanadaCaribbean small statesCentral African RepublicCentral Europe and the BalticsChadChileChinaColombiaComorosCongo, Dem. Rep.Congo, Rep.Costa RicaCote d'IvoireCroatiaCyprusCzech RepublicDenmarkDjiboutiDominicaDominican RepublicEarly-demographic dividendEast Asia & PacificEast Asia & Pacific (excluding high income)East Asia & Pacific (IDA & IBRD countries)EcuadorEgypt, Arab Rep.El SalvadorEquatorial GuineaEritreaEstoniaEthiopiaEuro areaEurope & Central AsiaEurope & Central Asia (excluding high income)Europe & Central Asia (IDA & IBRD countries)European UnionFaroe IslandsFijiFinlandFragile and conflict affected situationsFranceGabonGambia, TheGeorgiaGermanyGhanaGreeceGrenadaGuatemalaGuineaGuinea-BissauGuyanaHaitiHeavily indebted poor countries (HIPC)High incomeHondurasHong Kong SAR, ChinaHungaryIBRD onlyIcelandIDA & IBRD totalIDA blendIDA onlyIDA totalIndiaIndonesiaIran, Islamic Rep.IraqIrelandIsraelItalyJamaicaJapanJordanKazakhstanKenyaKiribatiKorea, Rep.KosovoKuwaitKyrgyz RepublicLao PDRLate-demographic dividendLatin America & Caribbean Latin America & Caribbean (excluding high income)Latin America & the Caribbean (IDA & IBRD countries)LatviaLeast developed countries: UN classificationLebanonLesothoLiberiaLibyaLithuaniaLow & middle incomeLow incomeLower middle incomeLuxembourgMacao SAR, ChinaMacedonia, FYRMadagascarMalawiMalaysiaMaldivesMaliMaltaMarshall IslandsMauritaniaMauritiusMexicoMicronesia, Fed. Sts.Middle East & North AfricaMiddle East & North Africa (excluding high income)Middle East & North Africa (IDA & IBRD countries)Middle incomeMoldovaMongoliaMontenegroMoroccoMozambiqueMyanmarNamibiaNepalNetherlandsNew ZealandNicaraguaNigerNigeriaNorth AmericaNorwayOECD membersOmanOther small statesPacific island small statesPakistanPalauPanamaPapua New GuineaParaguayPeruPhilippinesPolandPortugalPost-demographic dividendPre-demographic dividendQatarRomaniaRussian FederationRwandaSamoaSao Tome and PrincipeSaudi ArabiaSenegalSerbiaSeychellesSierra LeoneSingaporeSlovak RepublicSloveniaSmall statesSolomon IslandsSouth AfricaSouth AsiaSouth Asia (IDA & IBRD)South SudanSpainSri LankaSt. Kitts and NevisSt. LuciaSt. Vincent and the GrenadinesSub-Saharan Africa Sub-Saharan Africa (excluding high income)Sub-Saharan Africa (IDA & IBRD countries)SudanSurinameSwazilandSwedenSwitzerlandSyrian Arab RepublicTajikistanTanzaniaThailandTimor-LesteTogoTongaTrinidad and TobagoTunisiaTurkeyTuvaluUgandaUkraineUnited KingdomUnited StatesUpper middle incomeUruguayVanuatuVenezuela, RBVietnamWest Bank and GazaWorldYemen, Rep.ZambiaZimbabwe Timeline:
This timeline shows a graph from 1983 to 2016 of Late-demographic dividend. No data until 1982. Number of actual observations by date: 30.
Source name:
World Development Indicators
Source organization:
International Monetary Fund, Balance of Payments Statistics Yearbook and data files, and World Bank and OECD GDP estimates.
Categories, topics:
Economy & Growth, Private Sector, Trade
Last updated:
apr 23, 2017
Indicators value changes by year
Maximum:
12.117
jan 1, 2006
At the date of observation
Value
Absolute change
Change from previous value
jan 1, 1983
6.865
+6.865
0.0%
jan 1, 1984
6.109
-0.756
-11.01%
jan 1, 1985
6.11
+0.001
0.01%
jan 1, 1986
5.797
-0.313
-5.12%
jan 1, 1987
5.89
+0.092
1.59%
jan 1, 1988
6.045
+0.155
2.64%
jan 1, 1989
6.31
+0.266
4.39%
jan 1, 1994
8.895
+2.585
40.96%
jan 1, 1995
8.263
-0.633
-7.11%
jan 1, 1996
8.504
+0.242
2.93%
jan 1, 1997
8.215
-0.29
-3.41%
jan 1, 1998
9.427
+1.212
14.76%
jan 1, 1999
9.528
+0.101
1.07%
jan 1, 2000
10.59
+1.062
11.14%
jan 1, 2001
10.806
+0.216
2.04%
jan 1, 2002
11.333
+0.527
4.88%
jan 1, 2003
11.918
+0.585
5.16%
jan 1, 2004
10.592
-1.326
-11.13%
jan 1, 2005
10.888
+0.297
2.8%
jan 1, 2006
12.117
+1.229
11.29%
jan 1, 2007
11.821
-0.296
-2.45%
jan 1, 2008
11.722
-0.099
-0.84%
jan 1, 2009
11.184
-0.538
-4.59%
jan 1, 2010
10.216
-0.968
-8.65%
jan 1, 2011
9.099
-1.117
-10.94%
jan 1, 2012
9.699
+0.6
6.6%
jan 1, 2013
9.565
-0.134
-1.38%
jan 1, 2014
9.711
+0.146
1.52%
jan 1, 2015
10.704
+0.993
10.23%
jan 1, 2016
11.08
+0.376
3.51%
Ranking of countries by current statistics by years


Comments: