29
/
en
AIzaSyAYiBZKx7MnpbEhh9jyipgxe19OcubqV5w
April 1, 2024
76736
Bahamas, The
BHS
true
2
1
Trade in services (% of GDP)
2016,2015,2014,2013,2012,2011,2010,2009,2008,2007,2006,2005,2004,2003,2002,2001,2000,1999,1998,1997,1996,1995,1994,1993,1992,1991,1990,1989,1988,1987,1986,1985,1984,1983,1982,1981,1980,1979,1978,1977
This statistics in other country:
AfghanistanAlbaniaAlgeriaAngolaAntigua and BarbudaArab WorldArgentinaArmeniaArubaAustraliaAustriaAzerbaijanBahamas, TheBahrainBangladeshBarbadosBelarusBelgiumBelizeBeninBermudaBhutanBoliviaBosnia and HerzegovinaBotswanaBrazilBrunei DarussalamBulgariaBurkina FasoBurundiCabo VerdeCambodiaCameroonCanadaCaribbean small statesCentral African RepublicCentral Europe and the BalticsChadChileChinaColombiaComorosCongo, Dem. Rep.Congo, Rep.Costa RicaCote d'IvoireCroatiaCyprusCzech RepublicDenmarkDjiboutiDominicaDominican RepublicEarly-demographic dividendEast Asia & PacificEast Asia & Pacific (excluding high income)East Asia & Pacific (IDA & IBRD countries)EcuadorEgypt, Arab Rep.El SalvadorEquatorial GuineaEritreaEstoniaEthiopiaEuro areaEurope & Central AsiaEurope & Central Asia (excluding high income)Europe & Central Asia (IDA & IBRD countries)European UnionFaroe IslandsFijiFinlandFragile and conflict affected situationsFranceGabonGambia, TheGeorgiaGermanyGhanaGreeceGrenadaGuatemalaGuineaGuinea-BissauGuyanaHaitiHeavily indebted poor countries (HIPC)High incomeHondurasHong Kong SAR, ChinaHungaryIBRD onlyIcelandIDA & IBRD totalIDA blendIDA onlyIDA totalIndiaIndonesiaIran, Islamic Rep.IraqIrelandIsraelItalyJamaicaJapanJordanKazakhstanKenyaKiribatiKorea, Rep.KosovoKuwaitKyrgyz RepublicLao PDRLate-demographic dividendLatin America & Caribbean Latin America & Caribbean (excluding high income)Latin America & the Caribbean (IDA & IBRD countries)LatviaLeast developed countries: UN classificationLebanonLesothoLiberiaLibyaLithuaniaLow & middle incomeLow incomeLower middle incomeLuxembourgMacao SAR, ChinaMacedonia, FYRMadagascarMalawiMalaysiaMaldivesMaliMaltaMarshall IslandsMauritaniaMauritiusMexicoMicronesia, Fed. Sts.Middle East & North AfricaMiddle East & North Africa (excluding high income)Middle East & North Africa (IDA & IBRD countries)Middle incomeMoldovaMongoliaMontenegroMoroccoMozambiqueMyanmarNamibiaNepalNetherlandsNew ZealandNicaraguaNigerNigeriaNorth AmericaNorwayOECD membersOmanOther small statesPacific island small statesPakistanPalauPanamaPapua New GuineaParaguayPeruPhilippinesPolandPortugalPost-demographic dividendPre-demographic dividendQatarRomaniaRussian FederationRwandaSamoaSao Tome and PrincipeSaudi ArabiaSenegalSerbiaSeychellesSierra LeoneSingaporeSlovak RepublicSloveniaSmall statesSolomon IslandsSouth AfricaSouth AsiaSouth Asia (IDA & IBRD)South SudanSpainSri LankaSt. Kitts and NevisSt. LuciaSt. Vincent and the GrenadinesSub-Saharan Africa Sub-Saharan Africa (excluding high income)Sub-Saharan Africa (IDA & IBRD countries)SudanSurinameSwazilandSwedenSwitzerlandSyrian Arab RepublicTajikistanTanzaniaThailandTimor-LesteTogoTongaTrinidad and TobagoTunisiaTurkeyTuvaluUgandaUkraineUnited KingdomUnited StatesUpper middle incomeUruguayVanuatuVenezuela, RBVietnamWest Bank and GazaWorldYemen, Rep.ZambiaZimbabwe Timeline:
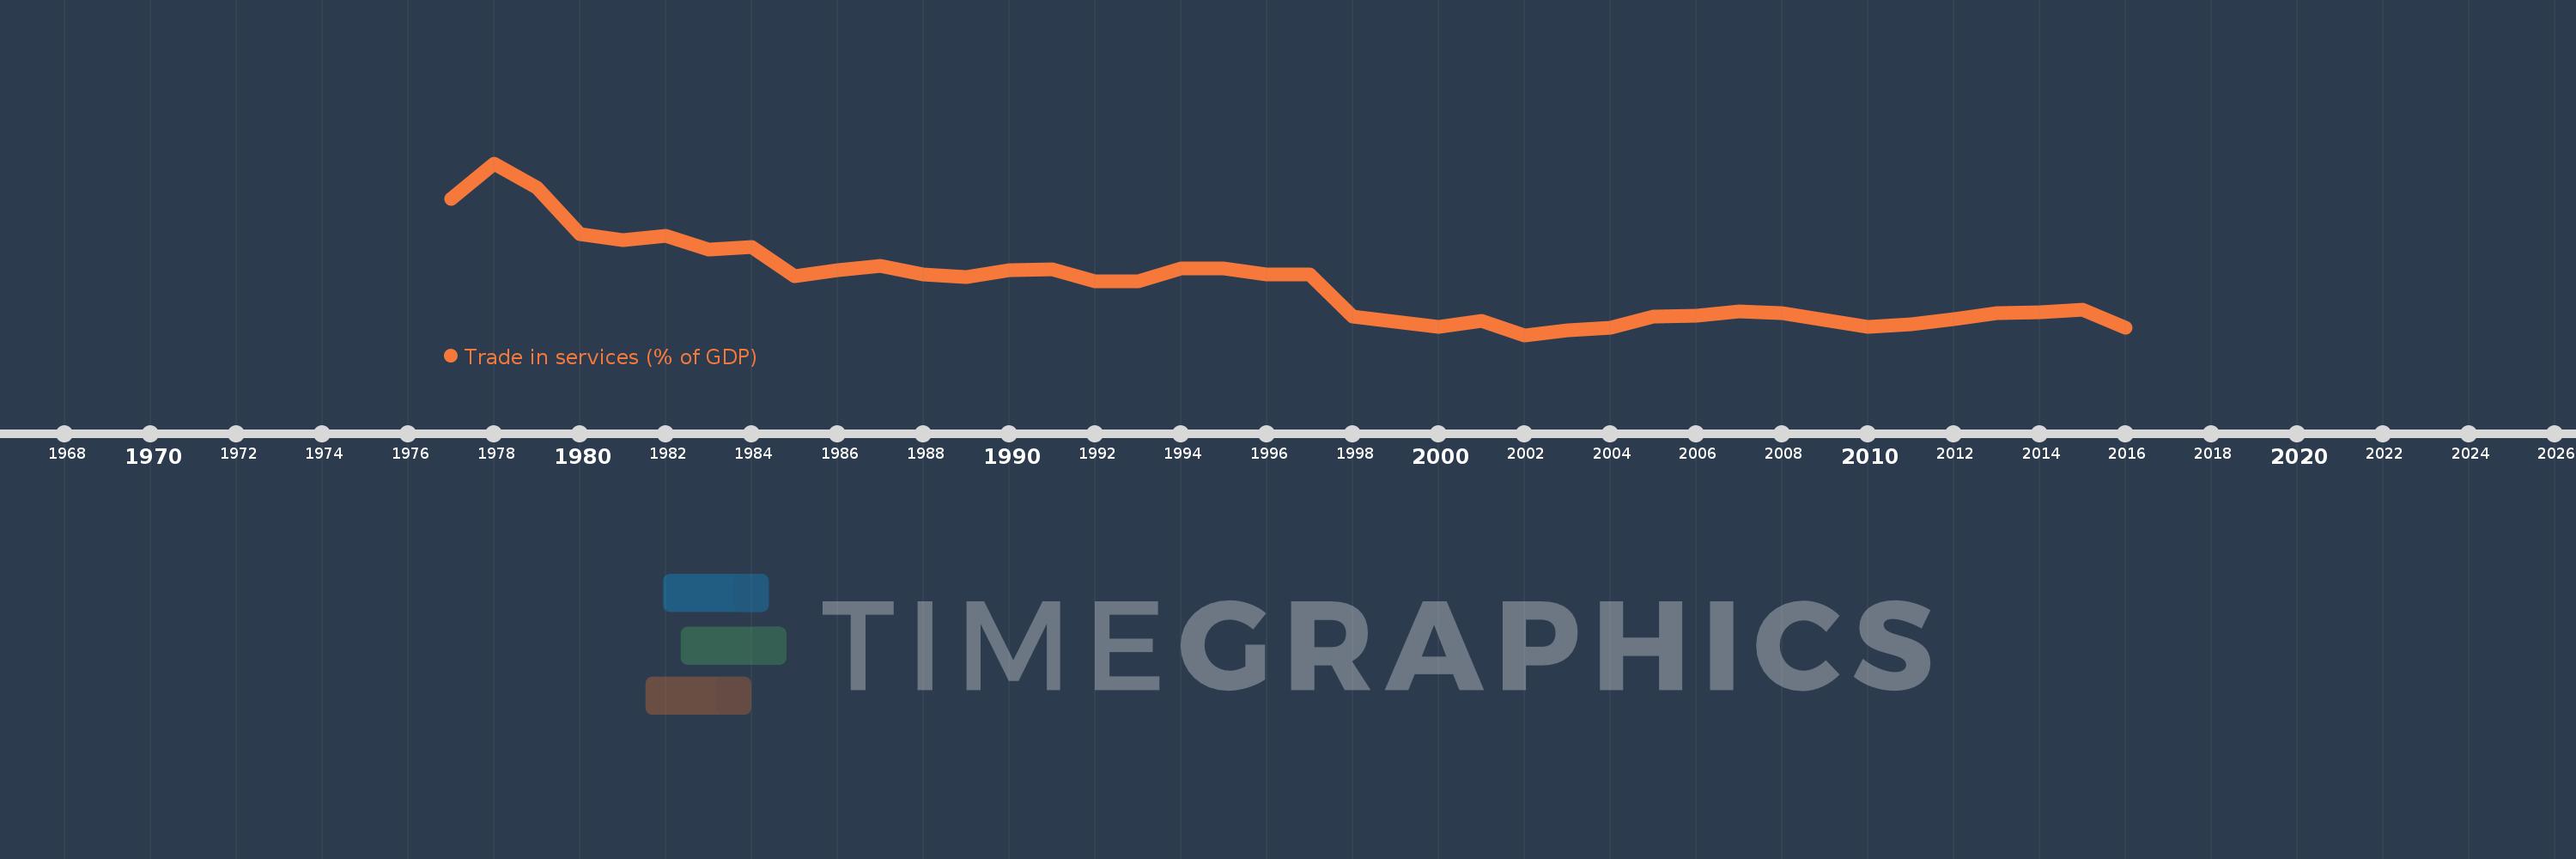
This timeline shows a graph from 1977 to 2016 of Bahamas, The. No data until 1976. Number of actual observations by date: 40.
Source name:
World Development Indicators
Source organization:
International Monetary Fund, Balance of Payments Statistics Yearbook and data files, and World Bank and OECD GDP estimates.
Categories, topics:
Economy & Growth, Private Sector, Trade
Last updated:
apr 23, 2017
Indicators value changes by year
Minimum:
42.623
jan 1, 2002
Maximum:
102.104
jan 1, 1978
At the date of observation
Value
Absolute change
Change from previous value
jan 1, 1977
89.908
+89.908
0.0%
jan 1, 1978
102.104
+12.196
13.56%
jan 1, 1979
93.705
-8.399
-8.23%
jan 1, 1980
77.636
-16.069
-17.15%
jan 1, 1981
75.616
-2.02
-2.6%
jan 1, 1982
76.979
+1.363
1.8%
jan 1, 1983
72.242
-4.736
-6.15%
jan 1, 1984
72.997
+0.755
1.05%
jan 1, 1985
63.138
-9.86
-13.51%
jan 1, 1986
65.166
+2.028
3.21%
jan 1, 1987
66.588
+1.423
2.18%
jan 1, 1988
63.651
-2.937
-4.41%
jan 1, 1989
62.685
-0.966
-1.52%
jan 1, 1990
65.196
+2.511
4.01%
jan 1, 1991
65.48
+0.284
0.44%
jan 1, 1992
61.17
-4.31
-6.58%
jan 1, 1993
61.277
+0.107
0.17%
jan 1, 1994
65.548
+4.271
6.97%
jan 1, 1995
65.597
+0.049
0.07%
jan 1, 1996
63.616
-1.981
-3.02%
jan 1, 1997
63.563
-0.053
-0.08%
jan 1, 1998
48.959
-14.605
-22.98%
jan 1, 1999
47.145
-1.814
-3.71%
jan 1, 2000
45.419
-1.726
-3.66%
jan 1, 2001
47.394
+1.976
4.35%
jan 1, 2002
42.623
-4.771
-10.07%
jan 1, 2003
44.236
+1.613
3.78%
jan 1, 2004
45.286
+1.05
2.37%
jan 1, 2005
48.988
+3.701
8.17%
jan 1, 2006
49.276
+0.288
0.59%
jan 1, 2007
50.805
+1.529
3.1%
jan 1, 2008
50.234
-0.572
-1.13%
jan 1, 2009
47.738
-2.495
-4.97%
jan 1, 2010
45.355
-2.384
-4.99%
jan 1, 2011
46.458
+1.104
2.43%
jan 1, 2012
47.987
+1.528
3.29%
jan 1, 2013
50.352
+2.365
4.93%
jan 1, 2014
50.452
+0.1
0.2%
jan 1, 2015
51.537
+1.086
2.15%
jan 1, 2016
45.27
-6.267
-12.16%
Ranking of countries by current statistics by years


Comments: