29
/
en
AIzaSyAYiBZKx7MnpbEhh9jyipgxe19OcubqV5w
April 1, 2024
26977
Early-demographic dividend
EAR
false
2
1
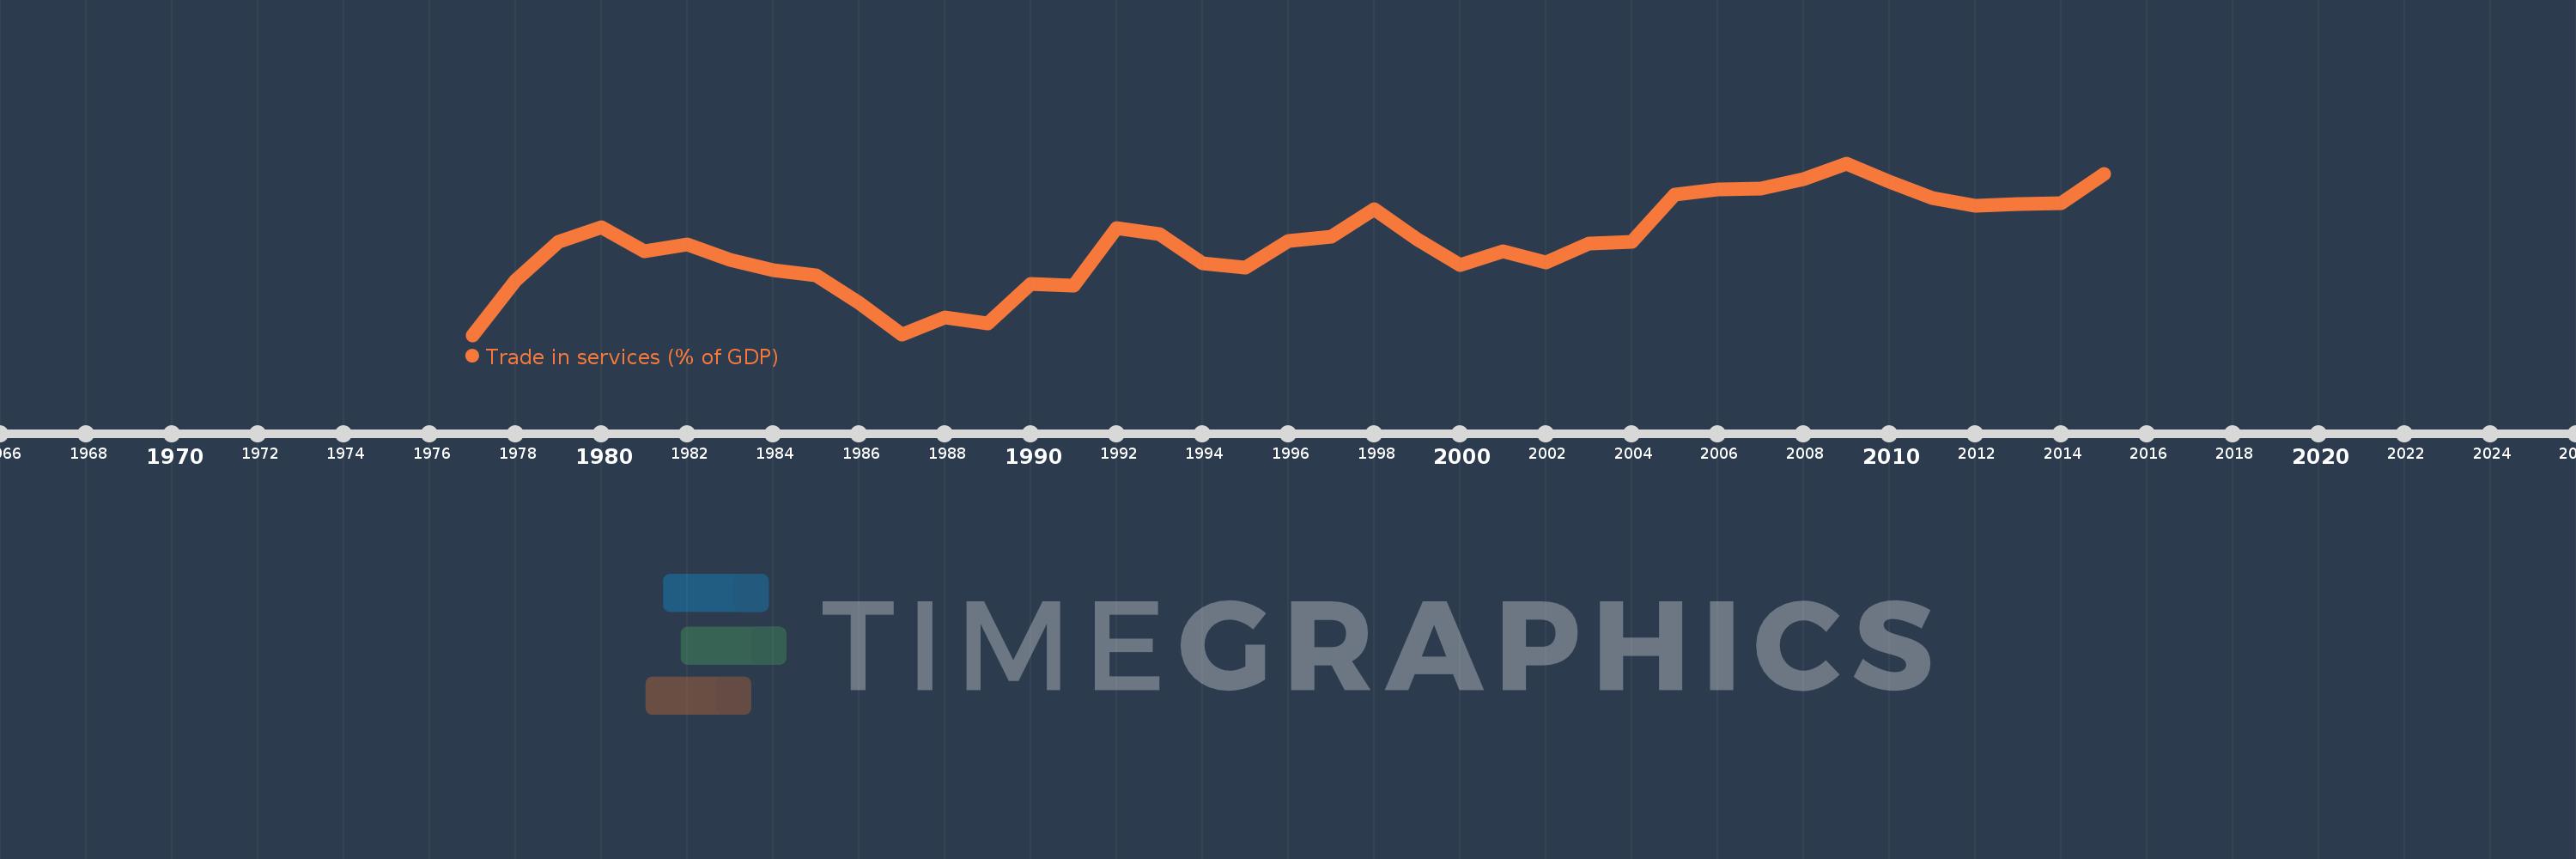
Trade in services (% of GDP)
2015,2014,2013,2012,2011,2010,2009,2008,2007,2006,2005,2004,2003,2002,2001,2000,1999,1998,1997,1996,1995,1994,1993,1992,1991,1990,1989,1988,1987,1986,1985,1984,1983,1982,1981,1980,1979,1978,1977
This statistics in other country:
AfghanistanAlbaniaAlgeriaAngolaAntigua and BarbudaArab WorldArgentinaArmeniaArubaAustraliaAustriaAzerbaijanBahamas, TheBahrainBangladeshBarbadosBelarusBelgiumBelizeBeninBermudaBhutanBoliviaBosnia and HerzegovinaBotswanaBrazilBrunei DarussalamBulgariaBurkina FasoBurundiCabo VerdeCambodiaCameroonCanadaCaribbean small statesCentral African RepublicCentral Europe and the BalticsChadChileChinaColombiaComorosCongo, Dem. Rep.Congo, Rep.Costa RicaCote d'IvoireCroatiaCyprusCzech RepublicDenmarkDjiboutiDominicaDominican RepublicEarly-demographic dividendEast Asia & PacificEast Asia & Pacific (excluding high income)East Asia & Pacific (IDA & IBRD countries)EcuadorEgypt, Arab Rep.El SalvadorEquatorial GuineaEritreaEstoniaEthiopiaEuro areaEurope & Central AsiaEurope & Central Asia (excluding high income)Europe & Central Asia (IDA & IBRD countries)European UnionFaroe IslandsFijiFinlandFragile and conflict affected situationsFranceGabonGambia, TheGeorgiaGermanyGhanaGreeceGrenadaGuatemalaGuineaGuinea-BissauGuyanaHaitiHeavily indebted poor countries (HIPC)High incomeHondurasHong Kong SAR, ChinaHungaryIBRD onlyIcelandIDA & IBRD totalIDA blendIDA onlyIDA totalIndiaIndonesiaIran, Islamic Rep.IraqIrelandIsraelItalyJamaicaJapanJordanKazakhstanKenyaKiribatiKorea, Rep.KosovoKuwaitKyrgyz RepublicLao PDRLate-demographic dividendLatin America & Caribbean Latin America & Caribbean (excluding high income)Latin America & the Caribbean (IDA & IBRD countries)LatviaLeast developed countries: UN classificationLebanonLesothoLiberiaLibyaLithuaniaLow & middle incomeLow incomeLower middle incomeLuxembourgMacao SAR, ChinaMacedonia, FYRMadagascarMalawiMalaysiaMaldivesMaliMaltaMarshall IslandsMauritaniaMauritiusMexicoMicronesia, Fed. Sts.Middle East & North AfricaMiddle East & North Africa (excluding high income)Middle East & North Africa (IDA & IBRD countries)Middle incomeMoldovaMongoliaMontenegroMoroccoMozambiqueMyanmarNamibiaNepalNetherlandsNew ZealandNicaraguaNigerNigeriaNorth AmericaNorwayOECD membersOmanOther small statesPacific island small statesPakistanPalauPanamaPapua New GuineaParaguayPeruPhilippinesPolandPortugalPost-demographic dividendPre-demographic dividendQatarRomaniaRussian FederationRwandaSamoaSao Tome and PrincipeSaudi ArabiaSenegalSerbiaSeychellesSierra LeoneSingaporeSlovak RepublicSloveniaSmall statesSolomon IslandsSouth AfricaSouth AsiaSouth Asia (IDA & IBRD)South SudanSpainSri LankaSt. Kitts and NevisSt. LuciaSt. Vincent and the GrenadinesSub-Saharan Africa Sub-Saharan Africa (excluding high income)Sub-Saharan Africa (IDA & IBRD countries)SudanSurinameSwazilandSwedenSwitzerlandSyrian Arab RepublicTajikistanTanzaniaThailandTimor-LesteTogoTongaTrinidad and TobagoTunisiaTurkeyTuvaluUgandaUkraineUnited KingdomUnited StatesUpper middle incomeUruguayVanuatuVenezuela, RBVietnamWest Bank and GazaWorldYemen, Rep.ZambiaZimbabwe Timeline:
This timeline shows a graph from 1977 to 2015 of Early-demographic dividend. No data until 1976. Number of actual observations by date: 39.
Source name:
World Development Indicators
Source organization:
International Monetary Fund, Balance of Payments Statistics Yearbook and data files, and World Bank and OECD GDP estimates.
Categories, topics:
Economy & Growth, Private Sector, Trade
Last updated:
apr 23, 2017
Indicators value changes by year
Maximum:
10.927
jan 1, 2009
At the date of observation
Value
Absolute change
Change from previous value
jan 1, 1977
7.181
+7.181
0.0%
jan 1, 1978
8.373
+1.192
16.6%
jan 1, 1979
9.222
+0.849
10.14%
jan 1, 1980
9.54
+0.318
3.45%
jan 1, 1981
9.016
-0.524
-5.5%
jan 1, 1982
9.149
+0.133
1.47%
jan 1, 1983
8.827
-0.321
-3.51%
jan 1, 1984
8.588
-0.24
-2.71%
jan 1, 1985
8.474
-0.113
-1.32%
jan 1, 1986
7.875
-0.599
-7.07%
jan 1, 1987
7.199
-0.676
-8.59%
jan 1, 1988
7.559
+0.36
5.0%
jan 1, 1989
7.436
-0.123
-1.63%
jan 1, 1990
8.304
+0.868
11.67%
jan 1, 1991
8.262
-0.042
-0.51%
jan 1, 1992
9.521
+1.259
15.24%
jan 1, 1993
9.378
-0.143
-1.51%
jan 1, 1994
8.742
-0.636
-6.78%
jan 1, 1995
8.653
-0.089
-1.02%
jan 1, 1996
9.231
+0.579
6.69%
jan 1, 1997
9.332
+0.101
1.09%
jan 1, 1998
9.93
+0.598
6.4%
jan 1, 1999
9.274
-0.656
-6.61%
jan 1, 2000
8.706
-0.568
-6.12%
jan 1, 2001
9.01
+0.304
3.49%
jan 1, 2002
8.772
-0.238
-2.64%
jan 1, 2003
9.184
+0.411
4.69%
jan 1, 2004
9.215
+0.031
0.34%
jan 1, 2005
10.234
+1.019
11.06%
jan 1, 2006
10.362
+0.128
1.25%
jan 1, 2007
10.38
+0.017
0.17%
jan 1, 2008
10.583
+0.204
1.96%
jan 1, 2009
10.927
+0.344
3.25%
jan 1, 2010
10.515
-0.412
-3.77%
jan 1, 2011
10.172
-0.344
-3.27%
jan 1, 2012
10.009
-0.163
-1.6%
jan 1, 2013
10.045
+0.036
0.36%
jan 1, 2014
10.047
+0.002
0.02%
jan 1, 2015
10.688
+0.64
6.37%
Ranking of countries by current statistics by years


Comments: