29
/
en
AIzaSyAYiBZKx7MnpbEhh9jyipgxe19OcubqV5w
April 1, 2024
170587
Korea, Rep.
KOR
true
2
1
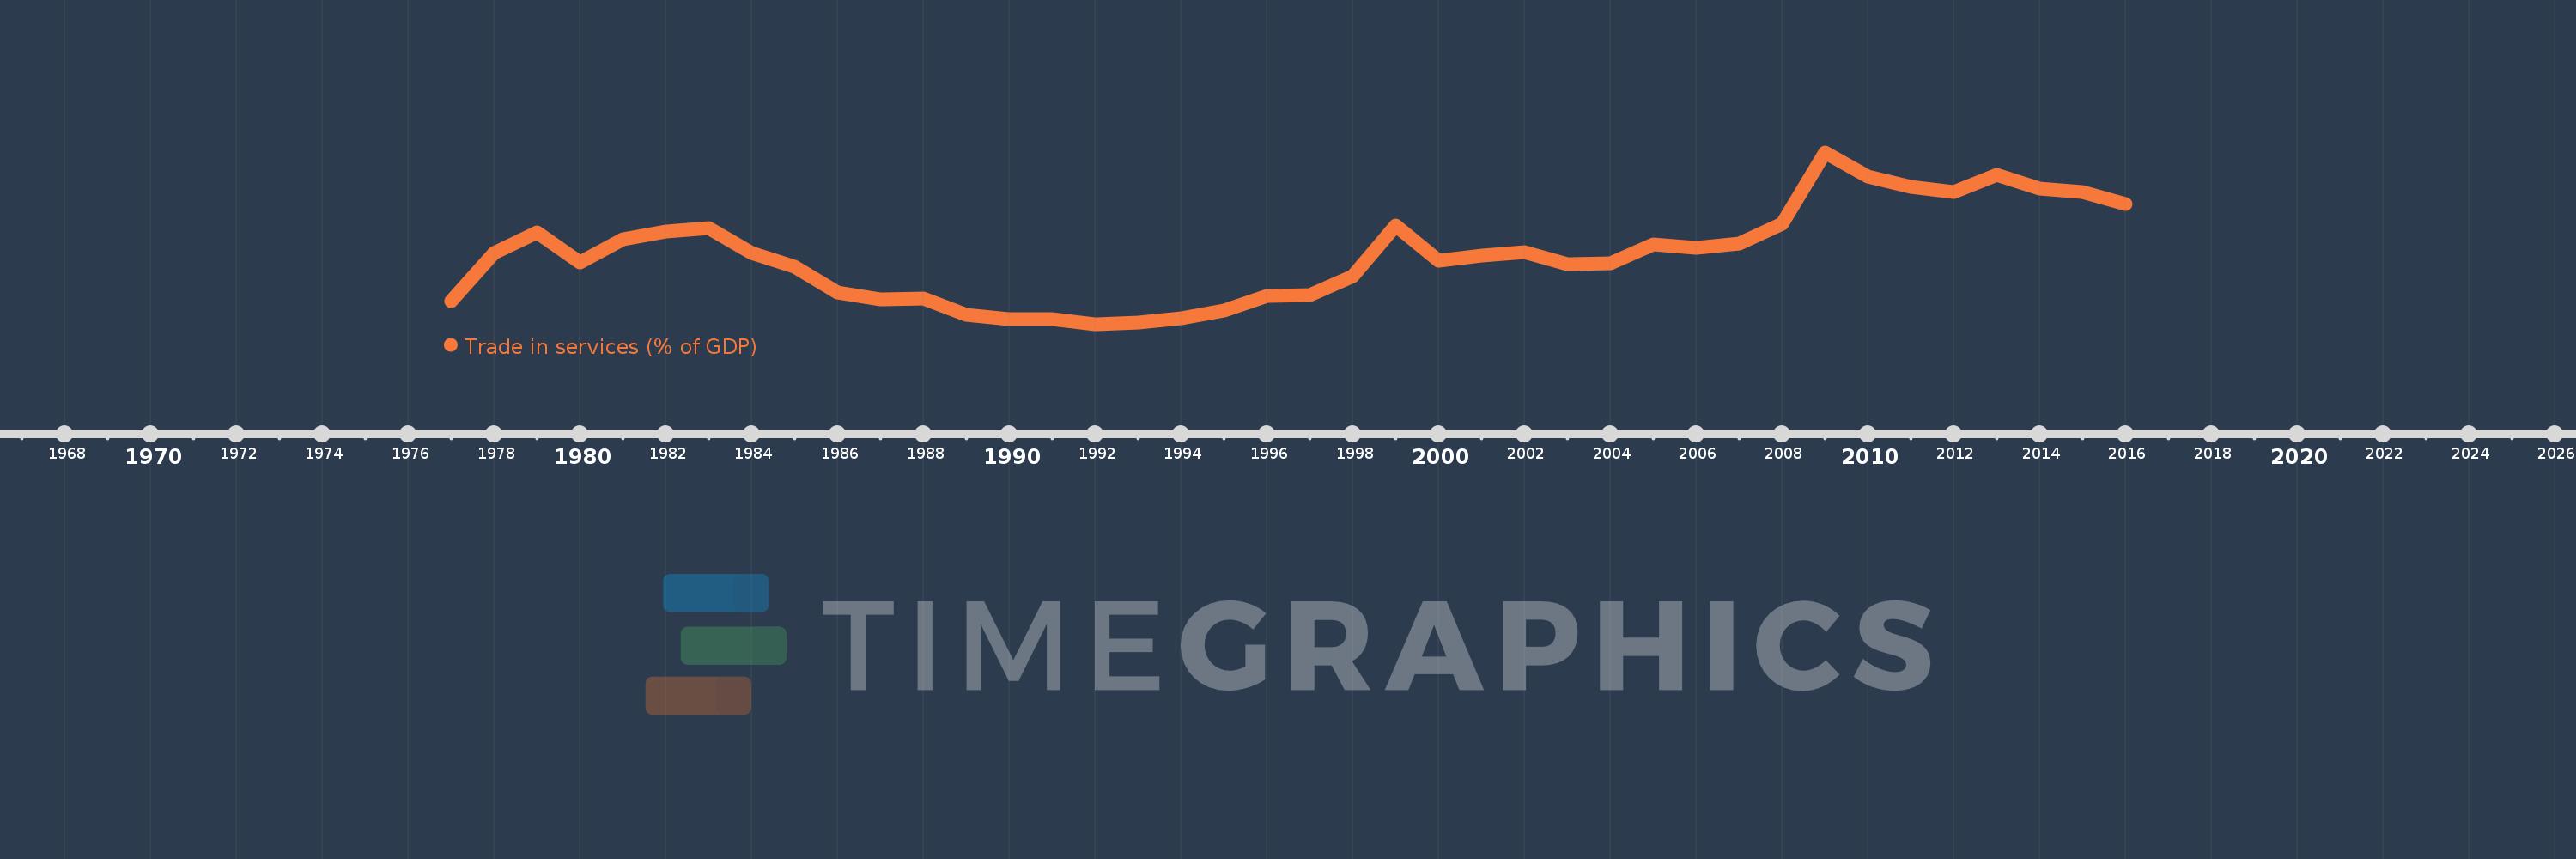
Trade in services (% of GDP)
2016,2015,2014,2013,2012,2011,2010,2009,2008,2007,2006,2005,2004,2003,2002,2001,2000,1999,1998,1997,1996,1995,1994,1993,1992,1991,1990,1989,1988,1987,1986,1985,1984,1983,1982,1981,1980,1979,1978,1977
This statistics in other country:
AfghanistanAlbaniaAlgeriaAngolaAntigua and BarbudaArab WorldArgentinaArmeniaArubaAustraliaAustriaAzerbaijanBahamas, TheBahrainBangladeshBarbadosBelarusBelgiumBelizeBeninBermudaBhutanBoliviaBosnia and HerzegovinaBotswanaBrazilBrunei DarussalamBulgariaBurkina FasoBurundiCabo VerdeCambodiaCameroonCanadaCaribbean small statesCentral African RepublicCentral Europe and the BalticsChadChileChinaColombiaComorosCongo, Dem. Rep.Congo, Rep.Costa RicaCote d'IvoireCroatiaCyprusCzech RepublicDenmarkDjiboutiDominicaDominican RepublicEarly-demographic dividendEast Asia & PacificEast Asia & Pacific (excluding high income)East Asia & Pacific (IDA & IBRD countries)EcuadorEgypt, Arab Rep.El SalvadorEquatorial GuineaEritreaEstoniaEthiopiaEuro areaEurope & Central AsiaEurope & Central Asia (excluding high income)Europe & Central Asia (IDA & IBRD countries)European UnionFaroe IslandsFijiFinlandFragile and conflict affected situationsFranceGabonGambia, TheGeorgiaGermanyGhanaGreeceGrenadaGuatemalaGuineaGuinea-BissauGuyanaHaitiHeavily indebted poor countries (HIPC)High incomeHondurasHong Kong SAR, ChinaHungaryIBRD onlyIcelandIDA & IBRD totalIDA blendIDA onlyIDA totalIndiaIndonesiaIran, Islamic Rep.IraqIrelandIsraelItalyJamaicaJapanJordanKazakhstanKenyaKiribatiKorea, Rep.KosovoKuwaitKyrgyz RepublicLao PDRLate-demographic dividendLatin America & Caribbean Latin America & Caribbean (excluding high income)Latin America & the Caribbean (IDA & IBRD countries)LatviaLeast developed countries: UN classificationLebanonLesothoLiberiaLibyaLithuaniaLow & middle incomeLow incomeLower middle incomeLuxembourgMacao SAR, ChinaMacedonia, FYRMadagascarMalawiMalaysiaMaldivesMaliMaltaMarshall IslandsMauritaniaMauritiusMexicoMicronesia, Fed. Sts.Middle East & North AfricaMiddle East & North Africa (excluding high income)Middle East & North Africa (IDA & IBRD countries)Middle incomeMoldovaMongoliaMontenegroMoroccoMozambiqueMyanmarNamibiaNepalNetherlandsNew ZealandNicaraguaNigerNigeriaNorth AmericaNorwayOECD membersOmanOther small statesPacific island small statesPakistanPalauPanamaPapua New GuineaParaguayPeruPhilippinesPolandPortugalPost-demographic dividendPre-demographic dividendQatarRomaniaRussian FederationRwandaSamoaSao Tome and PrincipeSaudi ArabiaSenegalSerbiaSeychellesSierra LeoneSingaporeSlovak RepublicSloveniaSmall statesSolomon IslandsSouth AfricaSouth AsiaSouth Asia (IDA & IBRD)South SudanSpainSri LankaSt. Kitts and NevisSt. LuciaSt. Vincent and the GrenadinesSub-Saharan Africa Sub-Saharan Africa (excluding high income)Sub-Saharan Africa (IDA & IBRD countries)SudanSurinameSwazilandSwedenSwitzerlandSyrian Arab RepublicTajikistanTanzaniaThailandTimor-LesteTogoTongaTrinidad and TobagoTunisiaTurkeyTuvaluUgandaUkraineUnited KingdomUnited StatesUpper middle incomeUruguayVanuatuVenezuela, RBVietnamWest Bank and GazaWorldYemen, Rep.ZambiaZimbabwe Timeline:
This timeline shows a graph from 1977 to 2016 of Korea, Rep.. No data until 1976. Number of actual observations by date: 40.
Source name:
World Development Indicators
Source organization:
International Monetary Fund, Balance of Payments Statistics Yearbook and data files, and World Bank and OECD GDP estimates.
Categories, topics:
Economy & Growth, Private Sector, Trade
Last updated:
apr 23, 2017
Indicators value changes by year
Maximum:
18.879
jan 1, 2009
At the date of observation
Value
Absolute change
Change from previous value
jan 1, 1977
8.669
+8.669
0.0%
jan 1, 1978
11.946
+3.278
37.81%
jan 1, 1979
13.366
+1.419
11.88%
jan 1, 1980
11.322
-2.044
-15.29%
jan 1, 1981
12.929
+1.607
14.19%
jan 1, 1982
13.454
+0.525
4.06%
jan 1, 1983
13.676
+0.222
1.65%
jan 1, 1984
11.99
-1.686
-12.33%
jan 1, 1985
10.992
-0.998
-8.33%
jan 1, 1986
9.223
-1.769
-16.09%
jan 1, 1987
8.761
-0.461
-5.0%
jan 1, 1988
8.843
+0.082
0.93%
jan 1, 1989
7.698
-1.145
-12.95%
jan 1, 1990
7.416
-0.282
-3.67%
jan 1, 1991
7.432
+0.016
0.21%
jan 1, 1992
7.071
-0.361
-4.85%
jan 1, 1993
7.157
+0.086
1.21%
jan 1, 1994
7.478
+0.322
4.5%
jan 1, 1995
8.029
+0.55
7.36%
jan 1, 1996
9.027
+0.998
12.44%
jan 1, 1997
9.092
+0.065
0.72%
jan 1, 1998
10.36
+1.268
13.94%
jan 1, 1999
13.88
+3.52
33.98%
jan 1, 2000
11.454
-2.426
-17.48%
jan 1, 2001
11.806
+0.352
3.07%
jan 1, 2002
12.033
+0.227
1.92%
jan 1, 2003
11.198
-0.835
-6.94%
jan 1, 2004
11.28
+0.082
0.74%
jan 1, 2005
12.563
+1.283
11.38%
jan 1, 2006
12.313
-0.25
-1.99%
jan 1, 2007
12.615
+0.302
2.45%
jan 1, 2008
13.944
+1.329
10.54%
jan 1, 2009
18.879
+4.935
35.39%
jan 1, 2010
17.196
-1.683
-8.92%
jan 1, 2011
16.515
-0.68
-3.96%
jan 1, 2012
16.14
-0.375
-2.27%
jan 1, 2013
17.36
+1.22
7.56%
jan 1, 2014
16.389
-0.971
-5.59%
jan 1, 2015
16.147
-0.242
-1.48%
jan 1, 2016
15.347
-0.8
-4.96%
Ranking of countries by current statistics by years


Comments: