29
/
en
AIzaSyAYiBZKx7MnpbEhh9jyipgxe19OcubqV5w
April 1, 2024
78532
Bangladesh
BGD
true
2
1
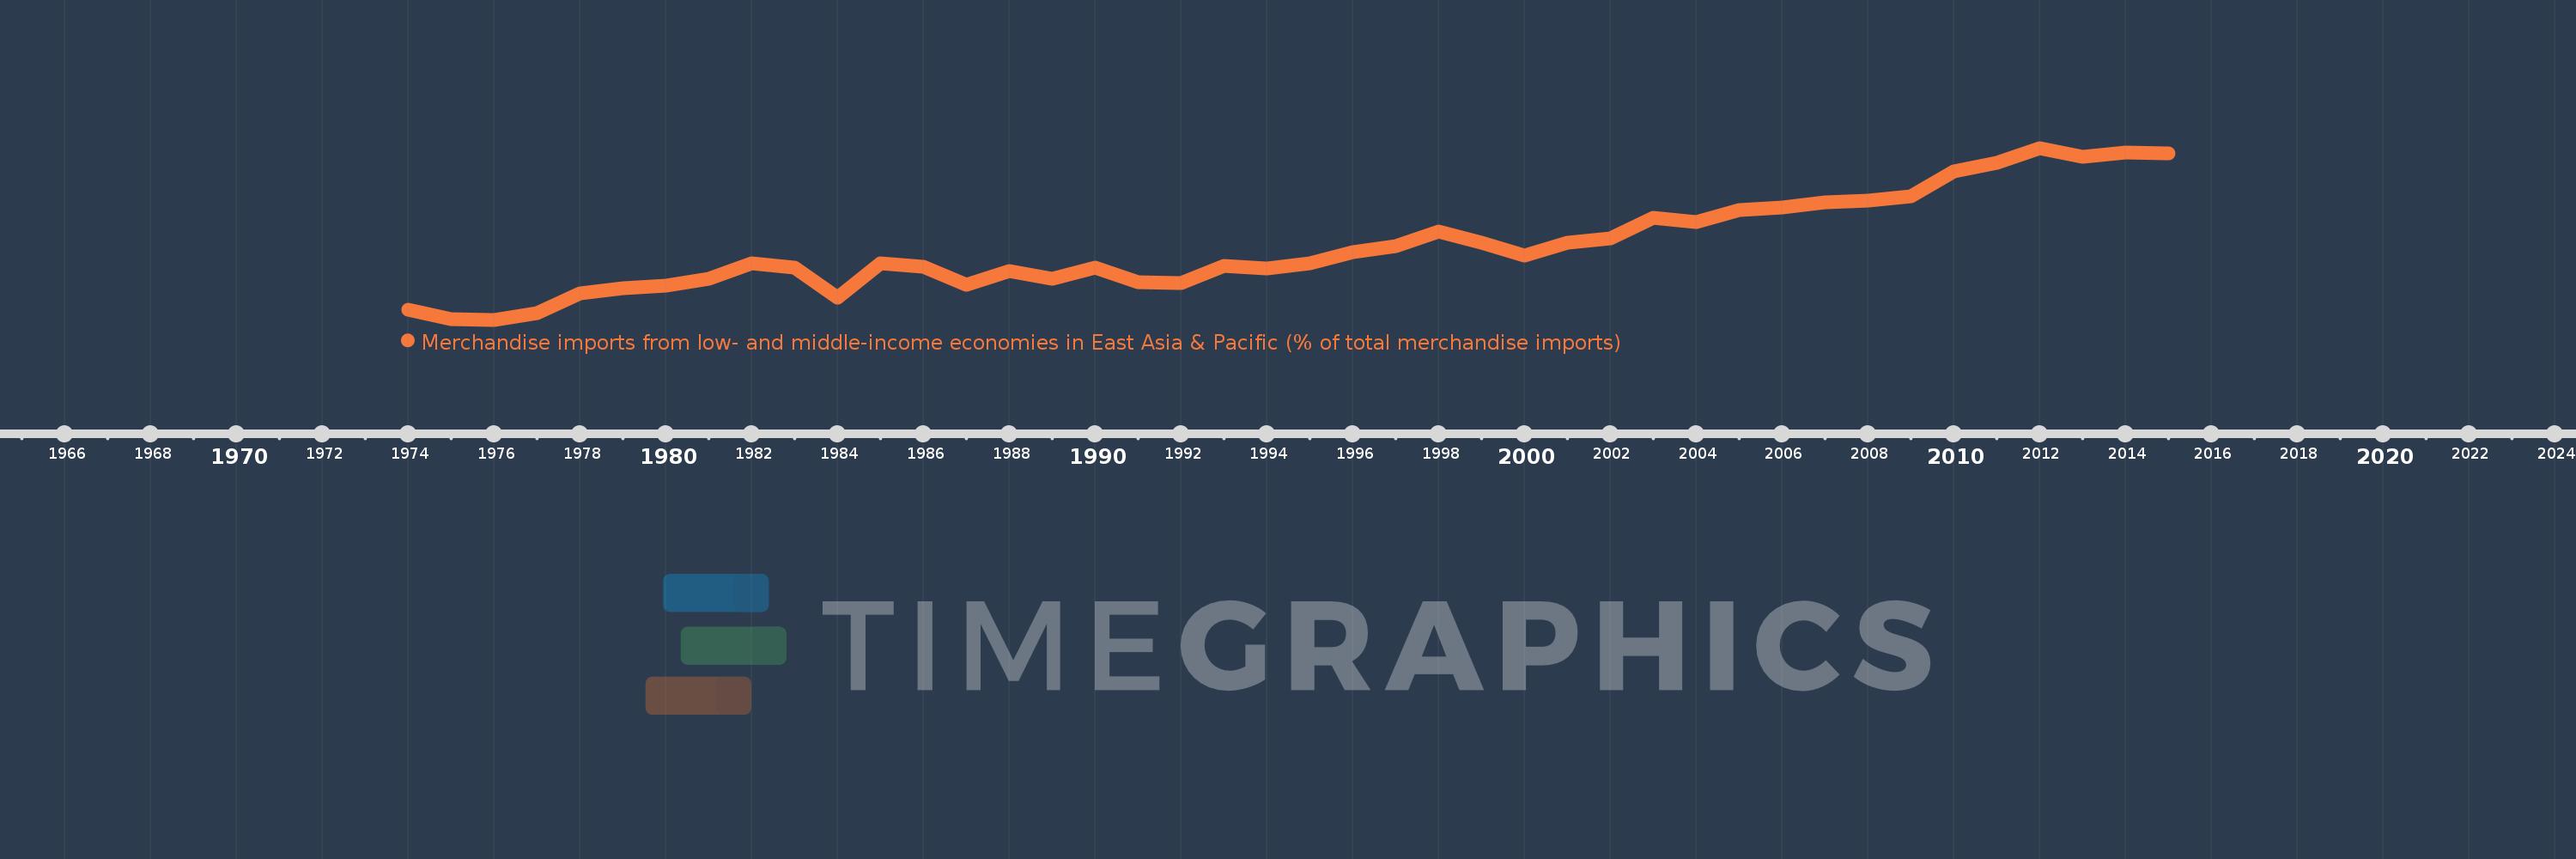
Merchandise imports from low- and middle-income economies in East Asia & Pacific (% of total merchandise imports)
2015,2014,2013,2012,2011,2010,2009,2008,2007,2006,2005,2004,2003,2002,2001,2000,1999,1998,1997,1996,1995,1994,1993,1992,1991,1990,1989,1988,1987,1986,1985,1984,1983,1982,1981,1980,1979,1978,1977,1976,1975,1974
This statistics in other country:
AfghanistanAlbaniaAlgeriaArab WorldArgentinaArmeniaArubaAustraliaAustriaAzerbaijanBahamas, TheBahrainBangladeshBarbadosBelarusBelgiumBelizeBeninBermudaBoliviaBrazilBrunei DarussalamBulgariaBurkina FasoBurundiCabo VerdeCambodiaCameroonCanadaCaribbean small statesCentral African RepublicCentral Europe and the BalticsChileChinaColombiaCongo, Rep.Costa RicaCote d'IvoireCroatiaCyprusCzech RepublicDenmarkDominicaDominican RepublicEarly-demographic dividendEast Asia & PacificEast Asia & Pacific (excluding high income)East Asia & Pacific (IDA & IBRD countries)EcuadorEgypt, Arab Rep.El SalvadorEstoniaEthiopiaEuro areaEurope & Central AsiaEurope & Central Asia (excluding high income)Europe & Central Asia (IDA & IBRD countries)European UnionFijiFinlandFragile and conflict affected situationsFranceFrench PolynesiaGabonGambia, TheGeorgiaGermanyGhanaGreeceGreenlandGrenadaGuatemalaHaitiHeavily indebted poor countries (HIPC)High incomeHondurasHong Kong SAR, ChinaHungaryIBRD onlyIcelandIDA & IBRD totalIDA blendIDA onlyIDA totalIndiaIndonesiaIran, Islamic Rep.IraqIrelandIsraelItalyJamaicaJapanJordanKazakhstanKenyaKorea, Dem. People’s Rep.Korea, Rep.KuwaitKyrgyz RepublicLao PDRLate-demographic dividendLatin America & Caribbean Latin America & Caribbean (excluding high income)Latin America & the Caribbean (IDA & IBRD countries)LatviaLeast developed countries: UN classificationLebanonLithuaniaLow & middle incomeLow incomeLower middle incomeLuxembourgMacao SAR, ChinaMacedonia, FYRMadagascarMalaysiaMaliMaltaMauritiusMexicoMiddle East & North AfricaMiddle East & North Africa (excluding high income)Middle East & North Africa (IDA & IBRD countries)Middle incomeMoldovaMongoliaMontenegroMoroccoMyanmarNetherlandsNew CaledoniaNew ZealandNicaraguaNigerNigeriaNorth AmericaNorwayOECD membersOmanOther small statesPacific island small statesPakistanPanamaPapua New GuineaParaguayPeruPhilippinesPolandPortugalPost-demographic dividendPre-demographic dividendQatarRomaniaRussian FederationSamoaSaudi ArabiaSenegalSerbiaSingaporeSlovak RepublicSloveniaSmall statesSolomon IslandsSomaliaSouth AfricaSouth AsiaSouth Asia (IDA & IBRD)SpainSri LankaSt. Kitts and NevisSt. LuciaSt. Vincent and the GrenadinesSub-Saharan Africa Sub-Saharan Africa (excluding high income)Sub-Saharan Africa (IDA & IBRD countries)SurinameSwedenSwitzerlandTanzaniaThailandTogoTongaTrinidad and TobagoTunisiaTurkeyUgandaUkraineUnited Arab EmiratesUnited KingdomUnited StatesUpper middle incomeUruguayVanuatuVenezuela, RBVietnamWorldYemen, Rep.ZambiaZimbabwe Timeline:
This timeline shows a graph from 1974 to 2015 of Bangladesh. No data until 1973. Number of actual observations by date: 42.
Source name:
World Development Indicators
Source organization:
World Bank staff estimates based data from International Monetary Fund's Direction of Trade database.
Categories, topics:
Private Sector, Trade
Last updated:
apr 23, 2017
Indicators value changes by year
Maximum:
31.028
jan 1, 2012
At the date of observation
Value
Absolute change
Change from previous value
jan 1, 1974
2.415
+2.415
0.0%
jan 1, 1975
0.826
-1.589
-65.78%
jan 1, 1976
0.69
-0.136
-16.48%
jan 1, 1977
1.867
+1.177
170.5%
jan 1, 1978
5.288
+3.421
183.21%
jan 1, 1979
6.291
+1.003
18.97%
jan 1, 1980
6.684
+0.393
6.25%
jan 1, 1981
7.998
+1.315
19.67%
jan 1, 1982
10.616
+2.618
32.73%
jan 1, 1983
9.971
-0.645
-6.07%
jan 1, 1984
4.641
-5.331
-53.46%
jan 1, 1985
10.612
+5.971
128.67%
jan 1, 1986
9.999
-0.613
-5.78%
jan 1, 1987
6.928
-3.07
-30.71%
jan 1, 1988
9.237
+2.309
33.33%
jan 1, 1989
7.881
-1.357
-14.69%
jan 1, 1990
9.901
+2.021
25.64%
jan 1, 1991
7.384
-2.517
-25.42%
jan 1, 1992
7.145
-0.24
-3.24%
jan 1, 1993
10.217
+3.072
43.0%
jan 1, 1994
9.749
-0.467
-4.57%
jan 1, 1995
10.643
+0.894
9.17%
jan 1, 1996
12.581
+1.937
18.2%
jan 1, 1997
13.752
+1.172
9.32%
jan 1, 1998
16.314
+2.562
18.63%
jan 1, 1999
14.328
-1.987
-12.18%
jan 1, 2000
12.087
-2.24
-15.64%
jan 1, 2001
14.329
+2.242
18.55%
jan 1, 2002
15.086
+0.757
5.28%
jan 1, 2003
18.653
+3.567
23.64%
jan 1, 2004
17.895
-0.758
-4.06%
jan 1, 2005
20.098
+2.203
12.31%
jan 1, 2006
20.57
+0.472
2.35%
jan 1, 2007
21.445
+0.875
4.25%
jan 1, 2008
21.711
+0.267
1.24%
jan 1, 2009
22.558
+0.847
3.9%
jan 1, 2010
26.849
+4.29
19.02%
jan 1, 2011
28.354
+1.505
5.61%
jan 1, 2012
31.028
+2.675
9.43%
jan 1, 2013
29.492
-1.536
-4.95%
jan 1, 2014
30.219
+0.727
2.46%
jan 1, 2015
30.148
-0.071
-0.24%
Ranking of countries by current statistics by years


Comments: