29
/
en
AIzaSyAYiBZKx7MnpbEhh9jyipgxe19OcubqV5w
April 1, 2024
85291
Bermuda
BMU
true
2
1
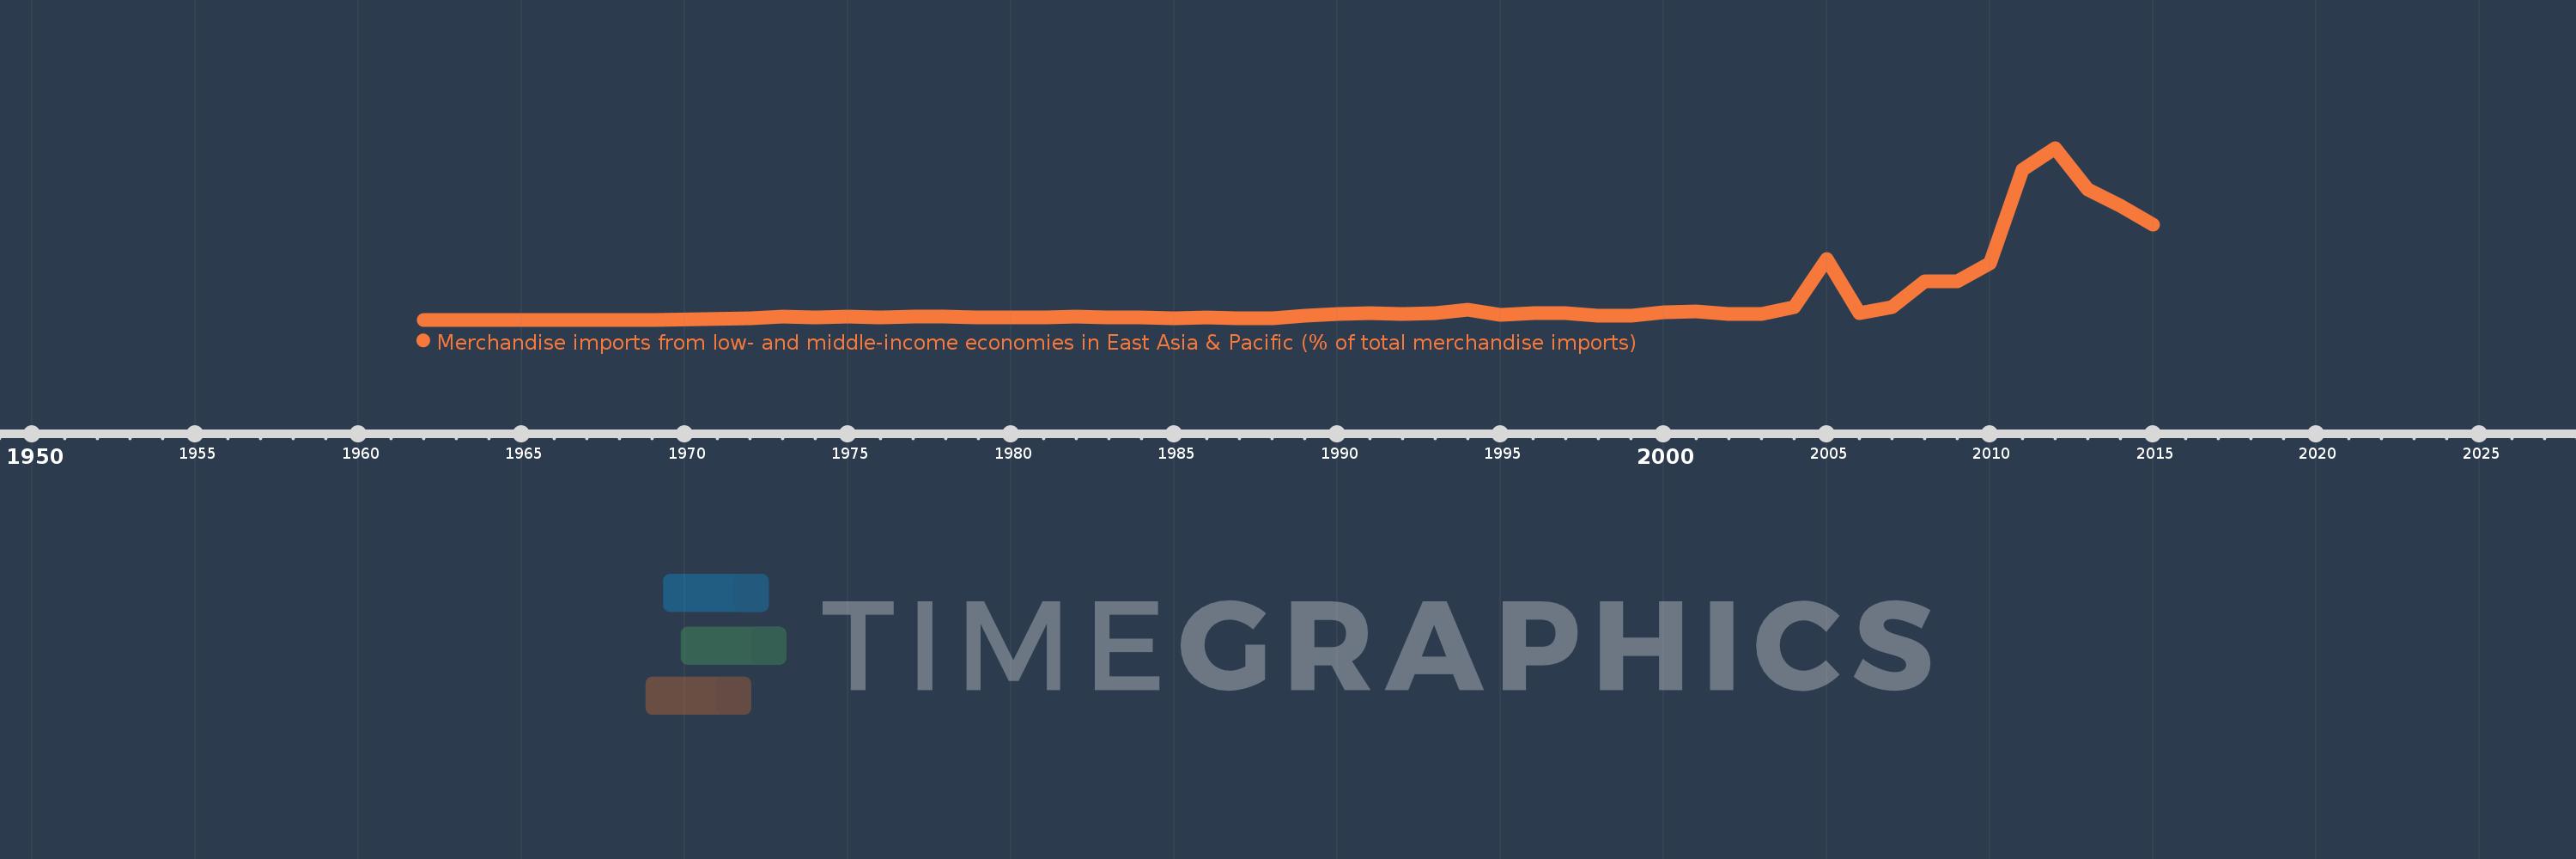
Merchandise imports from low- and middle-income economies in East Asia & Pacific (% of total merchandise imports)
2015,2014,2013,2012,2011,2010,2009,2008,2007,2006,2005,2004,2003,2002,2001,2000,1999,1998,1997,1996,1995,1994,1993,1992,1991,1990,1989,1988,1987,1986,1985,1984,1983,1982,1981,1980,1979,1978,1977,1976,1975,1974,1973,1972,1969,1968,1967,1966,1965,1964,1963,1962
This statistics in other country:
AfghanistanAlbaniaAlgeriaArab WorldArgentinaArmeniaArubaAustraliaAustriaAzerbaijanBahamas, TheBahrainBangladeshBarbadosBelarusBelgiumBelizeBeninBermudaBoliviaBrazilBrunei DarussalamBulgariaBurkina FasoBurundiCabo VerdeCambodiaCameroonCanadaCaribbean small statesCentral African RepublicCentral Europe and the BalticsChileChinaColombiaCongo, Rep.Costa RicaCote d'IvoireCroatiaCyprusCzech RepublicDenmarkDominicaDominican RepublicEarly-demographic dividendEast Asia & PacificEast Asia & Pacific (excluding high income)East Asia & Pacific (IDA & IBRD countries)EcuadorEgypt, Arab Rep.El SalvadorEstoniaEthiopiaEuro areaEurope & Central AsiaEurope & Central Asia (excluding high income)Europe & Central Asia (IDA & IBRD countries)European UnionFijiFinlandFragile and conflict affected situationsFranceFrench PolynesiaGabonGambia, TheGeorgiaGermanyGhanaGreeceGreenlandGrenadaGuatemalaHaitiHeavily indebted poor countries (HIPC)High incomeHondurasHong Kong SAR, ChinaHungaryIBRD onlyIcelandIDA & IBRD totalIDA blendIDA onlyIDA totalIndiaIndonesiaIran, Islamic Rep.IraqIrelandIsraelItalyJamaicaJapanJordanKazakhstanKenyaKorea, Dem. People’s Rep.Korea, Rep.KuwaitKyrgyz RepublicLao PDRLate-demographic dividendLatin America & Caribbean Latin America & Caribbean (excluding high income)Latin America & the Caribbean (IDA & IBRD countries)LatviaLeast developed countries: UN classificationLebanonLithuaniaLow & middle incomeLow incomeLower middle incomeLuxembourgMacao SAR, ChinaMacedonia, FYRMadagascarMalaysiaMaliMaltaMauritiusMexicoMiddle East & North AfricaMiddle East & North Africa (excluding high income)Middle East & North Africa (IDA & IBRD countries)Middle incomeMoldovaMongoliaMontenegroMoroccoMyanmarNetherlandsNew CaledoniaNew ZealandNicaraguaNigerNigeriaNorth AmericaNorwayOECD membersOmanOther small statesPacific island small statesPakistanPanamaPapua New GuineaParaguayPeruPhilippinesPolandPortugalPost-demographic dividendPre-demographic dividendQatarRomaniaRussian FederationSamoaSaudi ArabiaSenegalSerbiaSingaporeSlovak RepublicSloveniaSmall statesSolomon IslandsSomaliaSouth AfricaSouth AsiaSouth Asia (IDA & IBRD)SpainSri LankaSt. Kitts and NevisSt. LuciaSt. Vincent and the GrenadinesSub-Saharan Africa Sub-Saharan Africa (excluding high income)Sub-Saharan Africa (IDA & IBRD countries)SurinameSwedenSwitzerlandTanzaniaThailandTogoTongaTrinidad and TobagoTunisiaTurkeyUgandaUkraineUnited Arab EmiratesUnited KingdomUnited StatesUpper middle incomeUruguayVanuatuVenezuela, RBVietnamWorldYemen, Rep.ZambiaZimbabwe Timeline:
This timeline shows a graph from 1962 to 2015 of Bermuda. No data until 1961. Number of actual observations by date: 52.
Source name:
World Development Indicators
Source organization:
World Bank staff estimates based data from International Monetary Fund's Direction of Trade database.
Categories, topics:
Private Sector, Trade
Last updated:
apr 23, 2017
Indicators value changes by year
At the date of observation
Value
Absolute change
Change from previous value
jan 1, 1972
0.074
+0.074
%
jan 1, 1973
0.169
+0.096
129.82%
jan 1, 1974
0.135
-0.035
-20.6%
jan 1, 1975
0.175
+0.04
29.75%
jan 1, 1976
0.132
-0.042
-24.33%
jan 1, 1977
0.16
+0.028
21.45%
jan 1, 1978
0.158
-0.003
-1.68%
jan 1, 1979
0.112
-0.046
-28.9%
jan 1, 1980
0.137
+0.025
21.9%
jan 1, 1981
0.122
-0.015
-10.78%
jan 1, 1982
0.161
+0.039
31.62%
jan 1, 1983
0.118
-0.042
-26.21%
jan 1, 1984
0.141
+0.022
18.85%
jan 1, 1985
0.099
-0.042
-29.84%
jan 1, 1986
0.114
+0.015
15.06%
jan 1, 1987
0.099
-0.015
-13.09%
jan 1, 1988
0.063
-0.036
-36.14%
jan 1, 1989
0.212
+0.149
235.54%
jan 1, 1990
0.335
+0.123
58.15%
jan 1, 1991
0.359
+0.024
7.22%
jan 1, 1992
0.315
-0.044
-12.17%
jan 1, 1993
0.378
+0.063
19.93%
jan 1, 1994
0.56
+0.182
48.15%
jan 1, 1995
0.281
-0.279
-49.8%
jan 1, 1996
0.38
+0.099
35.14%
jan 1, 1997
0.345
-0.035
-9.29%
jan 1, 1998
0.245
-0.099
-28.85%
jan 1, 1999
0.208
-0.037
-15.04%
jan 1, 2000
0.417
+0.209
100.15%
jan 1, 2001
0.467
+0.05
12.07%
jan 1, 2002
0.315
-0.152
-32.58%
jan 1, 2003
0.338
+0.023
7.35%
jan 1, 2004
0.722
+0.384
113.46%
jan 1, 2005
3.368
+2.645
366.36%
jan 1, 2006
0.348
-3.02
-89.67%
jan 1, 2007
0.7
+0.352
101.22%
jan 1, 2008
2.127
+1.427
203.91%
jan 1, 2009
2.142
+0.015
0.68%
jan 1, 2010
3.114
+0.972
45.39%
jan 1, 2011
8.348
+5.235
168.12%
jan 1, 2012
9.54
+1.192
14.28%
jan 1, 2013
7.216
-2.324
-24.36%
jan 1, 2014
6.337
-0.879
-12.18%
jan 1, 2015
5.296
-1.041
-16.42%
Ranking of countries by current statistics by years


Comments: