29
/
en
AIzaSyAYiBZKx7MnpbEhh9jyipgxe19OcubqV5w
April 1, 2024
29284
East Asia & Pacific (IDA & IBRD countries)
TEA
false
2
1
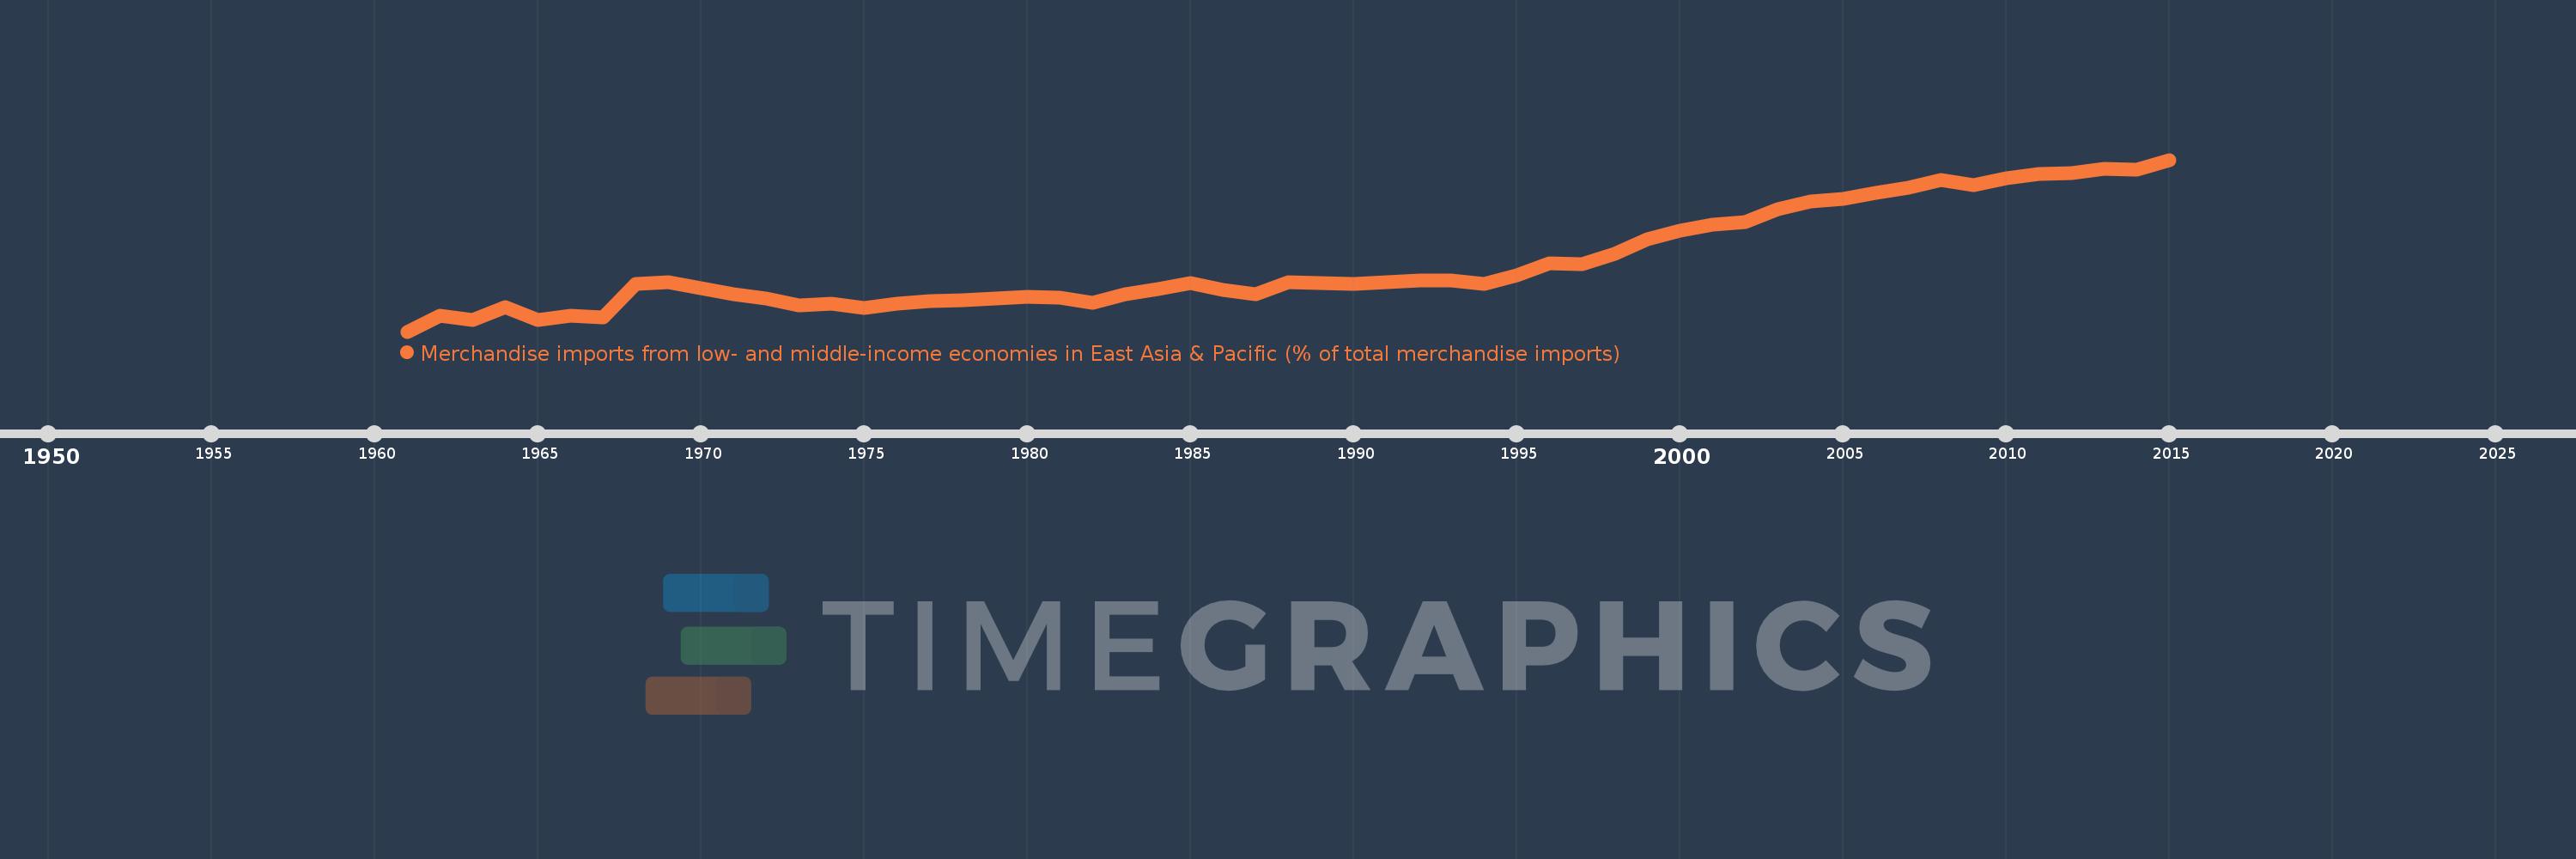
Merchandise imports from low- and middle-income economies in East Asia & Pacific (% of total merchandise imports)
2015,2014,2013,2012,2011,2010,2009,2008,2007,2006,2005,2004,2003,2002,2001,2000,1999,1998,1997,1996,1995,1994,1993,1992,1991,1990,1989,1988,1987,1986,1985,1984,1983,1982,1981,1980,1979,1978,1977,1976,1975,1974,1973,1972,1971,1970,1969,1968,1967,1966,1965,1964,1963,1962,1961
This statistics in other country:
AfghanistanAlbaniaAlgeriaArab WorldArgentinaArmeniaArubaAustraliaAustriaAzerbaijanBahamas, TheBahrainBangladeshBarbadosBelarusBelgiumBelizeBeninBermudaBoliviaBrazilBrunei DarussalamBulgariaBurkina FasoBurundiCabo VerdeCambodiaCameroonCanadaCaribbean small statesCentral African RepublicCentral Europe and the BalticsChileChinaColombiaCongo, Rep.Costa RicaCote d'IvoireCroatiaCyprusCzech RepublicDenmarkDominicaDominican RepublicEarly-demographic dividendEast Asia & PacificEast Asia & Pacific (excluding high income)East Asia & Pacific (IDA & IBRD countries)EcuadorEgypt, Arab Rep.El SalvadorEstoniaEthiopiaEuro areaEurope & Central AsiaEurope & Central Asia (excluding high income)Europe & Central Asia (IDA & IBRD countries)European UnionFijiFinlandFragile and conflict affected situationsFranceFrench PolynesiaGabonGambia, TheGeorgiaGermanyGhanaGreeceGreenlandGrenadaGuatemalaHaitiHeavily indebted poor countries (HIPC)High incomeHondurasHong Kong SAR, ChinaHungaryIBRD onlyIcelandIDA & IBRD totalIDA blendIDA onlyIDA totalIndiaIndonesiaIran, Islamic Rep.IraqIrelandIsraelItalyJamaicaJapanJordanKazakhstanKenyaKorea, Dem. People’s Rep.Korea, Rep.KuwaitKyrgyz RepublicLao PDRLate-demographic dividendLatin America & Caribbean Latin America & Caribbean (excluding high income)Latin America & the Caribbean (IDA & IBRD countries)LatviaLeast developed countries: UN classificationLebanonLithuaniaLow & middle incomeLow incomeLower middle incomeLuxembourgMacao SAR, ChinaMacedonia, FYRMadagascarMalaysiaMaliMaltaMauritiusMexicoMiddle East & North AfricaMiddle East & North Africa (excluding high income)Middle East & North Africa (IDA & IBRD countries)Middle incomeMoldovaMongoliaMontenegroMoroccoMyanmarNetherlandsNew CaledoniaNew ZealandNicaraguaNigerNigeriaNorth AmericaNorwayOECD membersOmanOther small statesPacific island small statesPakistanPanamaPapua New GuineaParaguayPeruPhilippinesPolandPortugalPost-demographic dividendPre-demographic dividendQatarRomaniaRussian FederationSamoaSaudi ArabiaSenegalSerbiaSingaporeSlovak RepublicSloveniaSmall statesSolomon IslandsSomaliaSouth AfricaSouth AsiaSouth Asia (IDA & IBRD)SpainSri LankaSt. Kitts and NevisSt. LuciaSt. Vincent and the GrenadinesSub-Saharan Africa Sub-Saharan Africa (excluding high income)Sub-Saharan Africa (IDA & IBRD countries)SurinameSwedenSwitzerlandTanzaniaThailandTogoTongaTrinidad and TobagoTunisiaTurkeyUgandaUkraineUnited Arab EmiratesUnited KingdomUnited StatesUpper middle incomeUruguayVanuatuVenezuela, RBVietnamWorldYemen, Rep.ZambiaZimbabwe Timeline:
This timeline shows a graph from 1961 to 2015 of East Asia & Pacific (IDA & IBRD countries). No data until 1960. Number of actual observations by date: 55.
Source name:
World Development Indicators
Source organization:
World Bank staff estimates based data from International Monetary Fund's Direction of Trade database.
Categories, topics:
Private Sector, Trade
Last updated:
apr 23, 2017
Indicators value changes by year
Maximum:
17.502
jan 1, 2015
At the date of observation
Value
Absolute change
Change from previous value
jan 1, 1961
1.732
+1.732
0.0%
jan 1, 1962
3.22
+1.489
85.97%
jan 1, 1963
2.821
-0.399
-12.39%
jan 1, 1964
3.952
+1.131
40.1%
jan 1, 1965
2.789
-1.163
-29.44%
jan 1, 1966
3.201
+0.412
14.78%
jan 1, 1967
3.019
-0.182
-5.69%
jan 1, 1968
6.106
+3.087
102.25%
jan 1, 1969
6.257
+0.151
2.47%
jan 1, 1970
5.718
-0.539
-8.62%
jan 1, 1971
5.186
-0.531
-9.29%
jan 1, 1972
4.741
-0.445
-8.58%
jan 1, 1973
4.158
-0.583
-12.29%
jan 1, 1974
4.315
+0.156
3.75%
jan 1, 1975
3.905
-0.41
-9.49%
jan 1, 1976
4.327
+0.422
10.8%
jan 1, 1977
4.559
+0.232
5.36%
jan 1, 1978
4.582
+0.024
0.52%
jan 1, 1979
4.759
+0.176
3.85%
jan 1, 1980
4.897
+0.139
2.91%
jan 1, 1981
4.838
-0.06
-1.22%
jan 1, 1982
4.363
-0.475
-9.82%
jan 1, 1983
5.155
+0.793
18.17%
jan 1, 1984
5.596
+0.441
8.55%
jan 1, 1985
6.161
+0.566
10.11%
jan 1, 1986
5.567
-0.594
-9.64%
jan 1, 1987
5.148
-0.419
-7.52%
jan 1, 1988
6.3
+1.152
22.37%
jan 1, 1989
6.153
-0.147
-2.34%
jan 1, 1990
6.114
-0.039
-0.63%
jan 1, 1991
6.256
+0.142
2.33%
jan 1, 1992
6.447
+0.191
3.06%
jan 1, 1993
6.44
-0.007
-0.11%
jan 1, 1994
6.087
-0.354
-5.49%
jan 1, 1995
6.924
+0.838
13.76%
jan 1, 1996
8.03
+1.106
15.97%
jan 1, 1997
7.887
-0.143
-1.78%
jan 1, 1998
8.906
+1.02
12.93%
jan 1, 1999
10.225
+1.319
14.81%
jan 1, 2000
10.963
+0.738
7.21%
jan 1, 2001
11.563
+0.6
5.48%
jan 1, 2002
11.75
+0.187
1.62%
jan 1, 2003
12.999
+1.249
10.63%
jan 1, 2004
13.692
+0.693
5.33%
jan 1, 2005
13.876
+0.184
1.34%
jan 1, 2006
14.501
+0.625
4.5%
jan 1, 2007
14.901
+0.4
2.76%
jan 1, 2008
15.637
+0.736
4.94%
jan 1, 2009
15.196
-0.441
-2.82%
jan 1, 2010
15.842
+0.647
4.25%
jan 1, 2011
16.216
+0.374
2.36%
jan 1, 2012
16.249
+0.033
0.2%
jan 1, 2013
16.636
+0.388
2.39%
jan 1, 2014
16.556
-0.08
-0.48%
jan 1, 2015
17.502
+0.945
5.71%
Ranking of countries by current statistics by years


Comments: