29
/
en
AIzaSyAYiBZKx7MnpbEhh9jyipgxe19OcubqV5w
April 1, 2024
216723
Pakistan
PAK
true
2
1
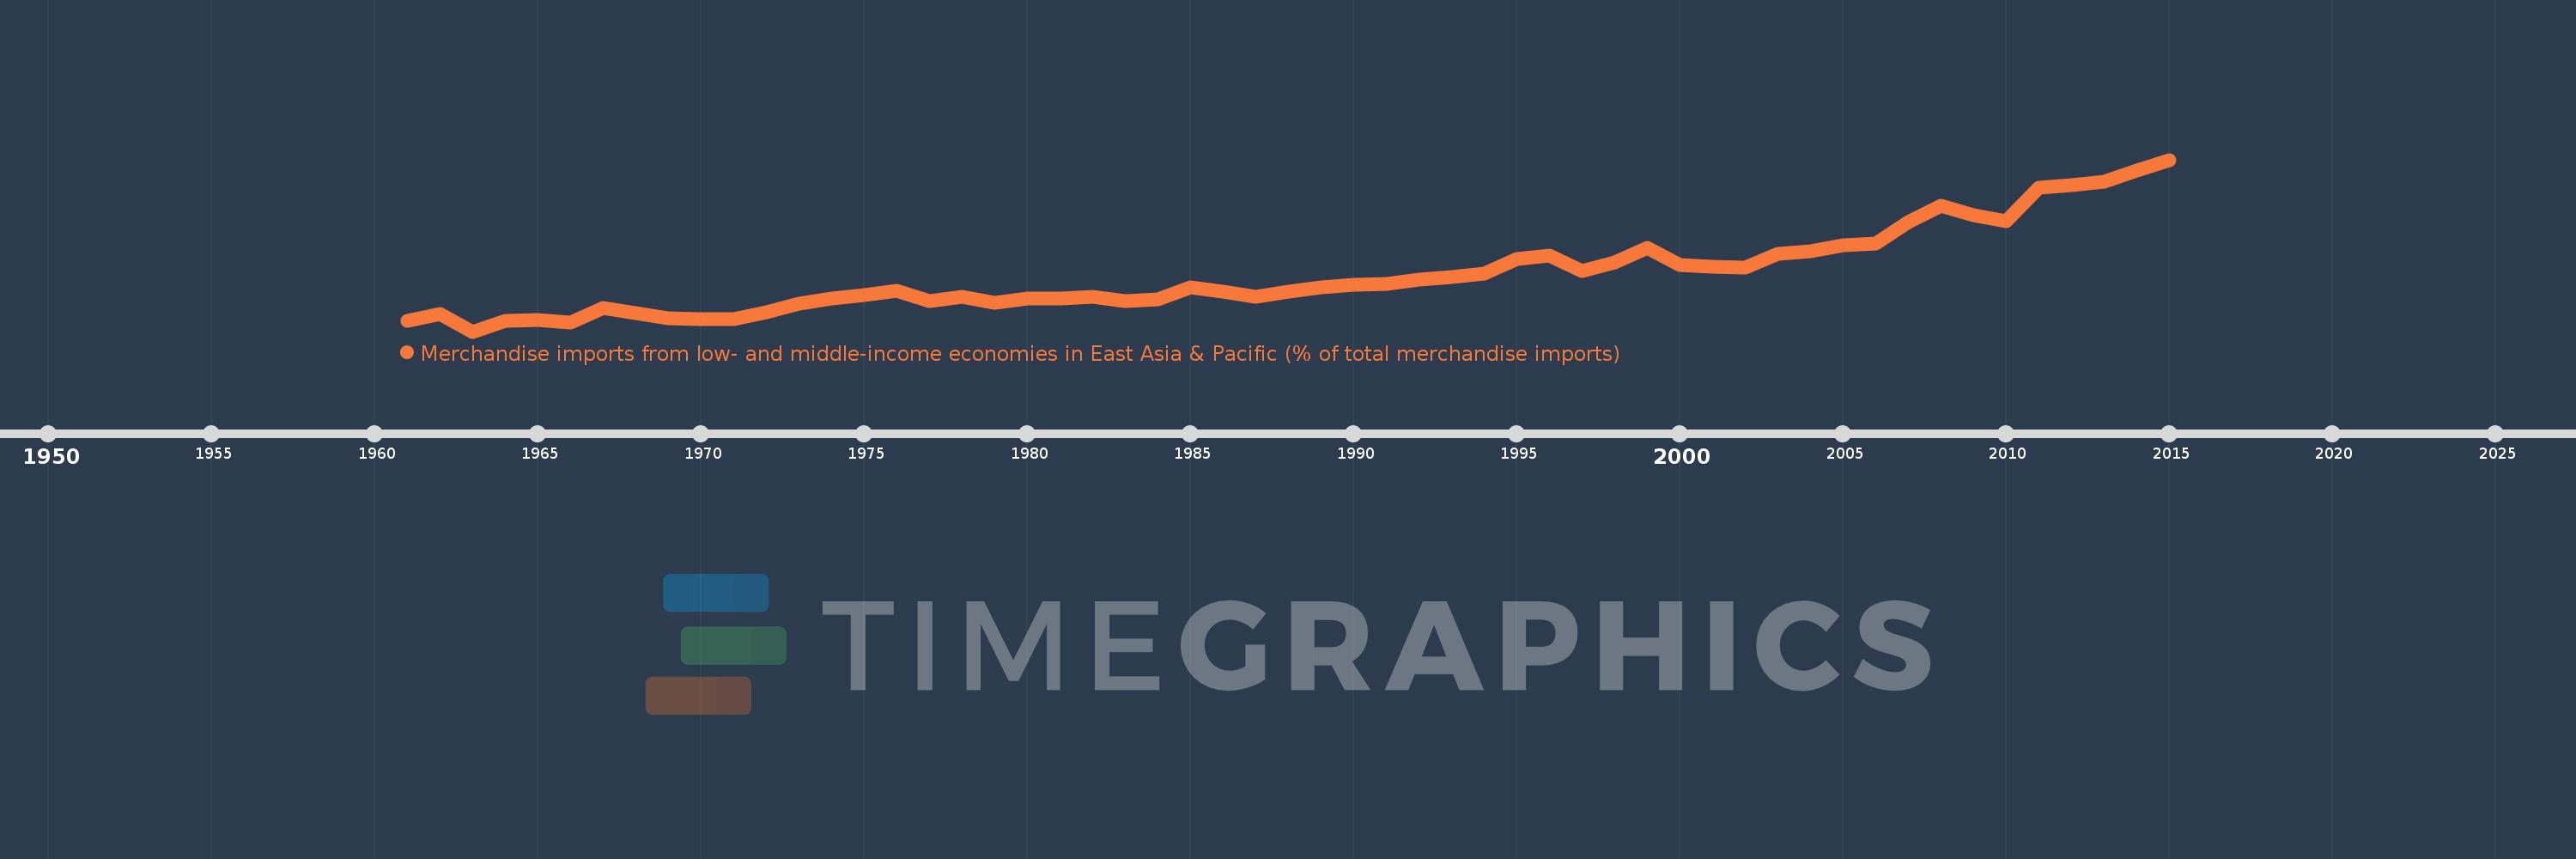
Merchandise imports from low- and middle-income economies in East Asia & Pacific (% of total merchandise imports)
2015,2014,2013,2012,2011,2010,2009,2008,2007,2006,2005,2004,2003,2002,2001,2000,1999,1998,1997,1996,1995,1994,1993,1992,1991,1990,1989,1988,1987,1986,1985,1984,1983,1982,1981,1980,1979,1978,1977,1976,1975,1974,1973,1972,1971,1970,1969,1968,1967,1966,1965,1964,1963,1962,1961
This statistics in other country:
AfghanistanAlbaniaAlgeriaArab WorldArgentinaArmeniaArubaAustraliaAustriaAzerbaijanBahamas, TheBahrainBangladeshBarbadosBelarusBelgiumBelizeBeninBermudaBoliviaBrazilBrunei DarussalamBulgariaBurkina FasoBurundiCabo VerdeCambodiaCameroonCanadaCaribbean small statesCentral African RepublicCentral Europe and the BalticsChileChinaColombiaCongo, Rep.Costa RicaCote d'IvoireCroatiaCyprusCzech RepublicDenmarkDominicaDominican RepublicEarly-demographic dividendEast Asia & PacificEast Asia & Pacific (excluding high income)East Asia & Pacific (IDA & IBRD countries)EcuadorEgypt, Arab Rep.El SalvadorEstoniaEthiopiaEuro areaEurope & Central AsiaEurope & Central Asia (excluding high income)Europe & Central Asia (IDA & IBRD countries)European UnionFijiFinlandFragile and conflict affected situationsFranceFrench PolynesiaGabonGambia, TheGeorgiaGermanyGhanaGreeceGreenlandGrenadaGuatemalaHaitiHeavily indebted poor countries (HIPC)High incomeHondurasHong Kong SAR, ChinaHungaryIBRD onlyIcelandIDA & IBRD totalIDA blendIDA onlyIDA totalIndiaIndonesiaIran, Islamic Rep.IraqIrelandIsraelItalyJamaicaJapanJordanKazakhstanKenyaKorea, Dem. People’s Rep.Korea, Rep.KuwaitKyrgyz RepublicLao PDRLate-demographic dividendLatin America & Caribbean Latin America & Caribbean (excluding high income)Latin America & the Caribbean (IDA & IBRD countries)LatviaLeast developed countries: UN classificationLebanonLithuaniaLow & middle incomeLow incomeLower middle incomeLuxembourgMacao SAR, ChinaMacedonia, FYRMadagascarMalaysiaMaliMaltaMauritiusMexicoMiddle East & North AfricaMiddle East & North Africa (excluding high income)Middle East & North Africa (IDA & IBRD countries)Middle incomeMoldovaMongoliaMontenegroMoroccoMyanmarNetherlandsNew CaledoniaNew ZealandNicaraguaNigerNigeriaNorth AmericaNorwayOECD membersOmanOther small statesPacific island small statesPakistanPanamaPapua New GuineaParaguayPeruPhilippinesPolandPortugalPost-demographic dividendPre-demographic dividendQatarRomaniaRussian FederationSamoaSaudi ArabiaSenegalSerbiaSingaporeSlovak RepublicSloveniaSmall statesSolomon IslandsSomaliaSouth AfricaSouth AsiaSouth Asia (IDA & IBRD)SpainSri LankaSt. Kitts and NevisSt. LuciaSt. Vincent and the GrenadinesSub-Saharan Africa Sub-Saharan Africa (excluding high income)Sub-Saharan Africa (IDA & IBRD countries)SurinameSwedenSwitzerlandTanzaniaThailandTogoTongaTrinidad and TobagoTunisiaTurkeyUgandaUkraineUnited Arab EmiratesUnited KingdomUnited StatesUpper middle incomeUruguayVanuatuVenezuela, RBVietnamWorldYemen, Rep.ZambiaZimbabwe Timeline:
This timeline shows a graph from 1961 to 2015 of Pakistan. No data until 1960. Number of actual observations by date: 55.
Source name:
World Development Indicators
Source organization:
World Bank staff estimates based data from International Monetary Fund's Direction of Trade database.
Categories, topics:
Private Sector, Trade
Last updated:
apr 23, 2017
Indicators value changes by year
Maximum:
32.868
jan 1, 2015
At the date of observation
Value
Absolute change
Change from previous value
jan 1, 1961
3.06
+3.06
0.0%
jan 1, 1962
4.292
+1.231
40.23%
jan 1, 1963
1.03
-3.261
-76.0%
jan 1, 1964
2.942
+1.912
185.59%
jan 1, 1965
3.151
+0.209
7.11%
jan 1, 1966
2.725
-0.426
-13.53%
jan 1, 1967
5.46
+2.736
100.41%
jan 1, 1968
4.526
-0.934
-17.1%
jan 1, 1969
3.481
-1.045
-23.09%
jan 1, 1970
3.278
-0.203
-5.83%
jan 1, 1971
3.361
+0.083
2.54%
jan 1, 1972
4.645
+1.284
38.2%
jan 1, 1973
6.2
+1.555
33.47%
jan 1, 1974
7.184
+0.983
15.86%
jan 1, 1975
7.858
+0.675
9.39%
jan 1, 1976
8.545
+0.687
8.74%
jan 1, 1977
6.715
-1.83
-21.42%
jan 1, 1978
7.444
+0.73
10.87%
jan 1, 1979
6.317
-1.127
-15.14%
jan 1, 1980
7.233
+0.916
14.49%
jan 1, 1981
7.122
-0.111
-1.54%
jan 1, 1982
7.406
+0.284
3.99%
jan 1, 1983
6.753
-0.652
-8.81%
jan 1, 1984
7.069
+0.316
4.68%
jan 1, 1985
9.168
+2.099
29.69%
jan 1, 1986
8.403
-0.765
-8.34%
jan 1, 1987
7.534
-0.869
-10.35%
jan 1, 1988
8.489
+0.955
12.68%
jan 1, 1989
9.162
+0.673
7.92%
jan 1, 1990
9.714
+0.551
6.02%
jan 1, 1991
9.904
+0.19
1.96%
jan 1, 1992
10.714
+0.81
8.18%
jan 1, 1993
11.166
+0.452
4.22%
jan 1, 1994
11.738
+0.572
5.12%
jan 1, 1995
14.482
+2.744
23.38%
jan 1, 1996
15.189
+0.707
4.88%
jan 1, 1997
12.314
-2.876
-18.93%
jan 1, 1998
13.812
+1.498
12.17%
jan 1, 1999
16.553
+2.741
19.84%
jan 1, 2000
13.395
-3.158
-19.08%
jan 1, 2001
12.991
-0.403
-3.01%
jan 1, 2002
12.931
-0.06
-0.46%
jan 1, 2003
15.465
+2.533
19.59%
jan 1, 2004
15.989
+0.524
3.39%
jan 1, 2005
16.979
+0.99
6.19%
jan 1, 2006
17.317
+0.339
1.99%
jan 1, 2007
21.307
+3.989
23.04%
jan 1, 2008
24.317
+3.01
14.13%
jan 1, 2009
22.548
-1.769
-7.27%
jan 1, 2010
21.417
-1.131
-5.02%
jan 1, 2011
27.729
+6.312
29.47%
jan 1, 2012
28.231
+0.502
1.81%
jan 1, 2013
28.788
+0.558
1.98%
jan 1, 2014
30.828
+2.04
7.09%
jan 1, 2015
32.868
+2.04
6.62%
Ranking of countries by current statistics by years


Comments: