29
/
en
AIzaSyAYiBZKx7MnpbEhh9jyipgxe19OcubqV5w
April 1, 2024
130746
Ethiopia
ETH
true
2
1
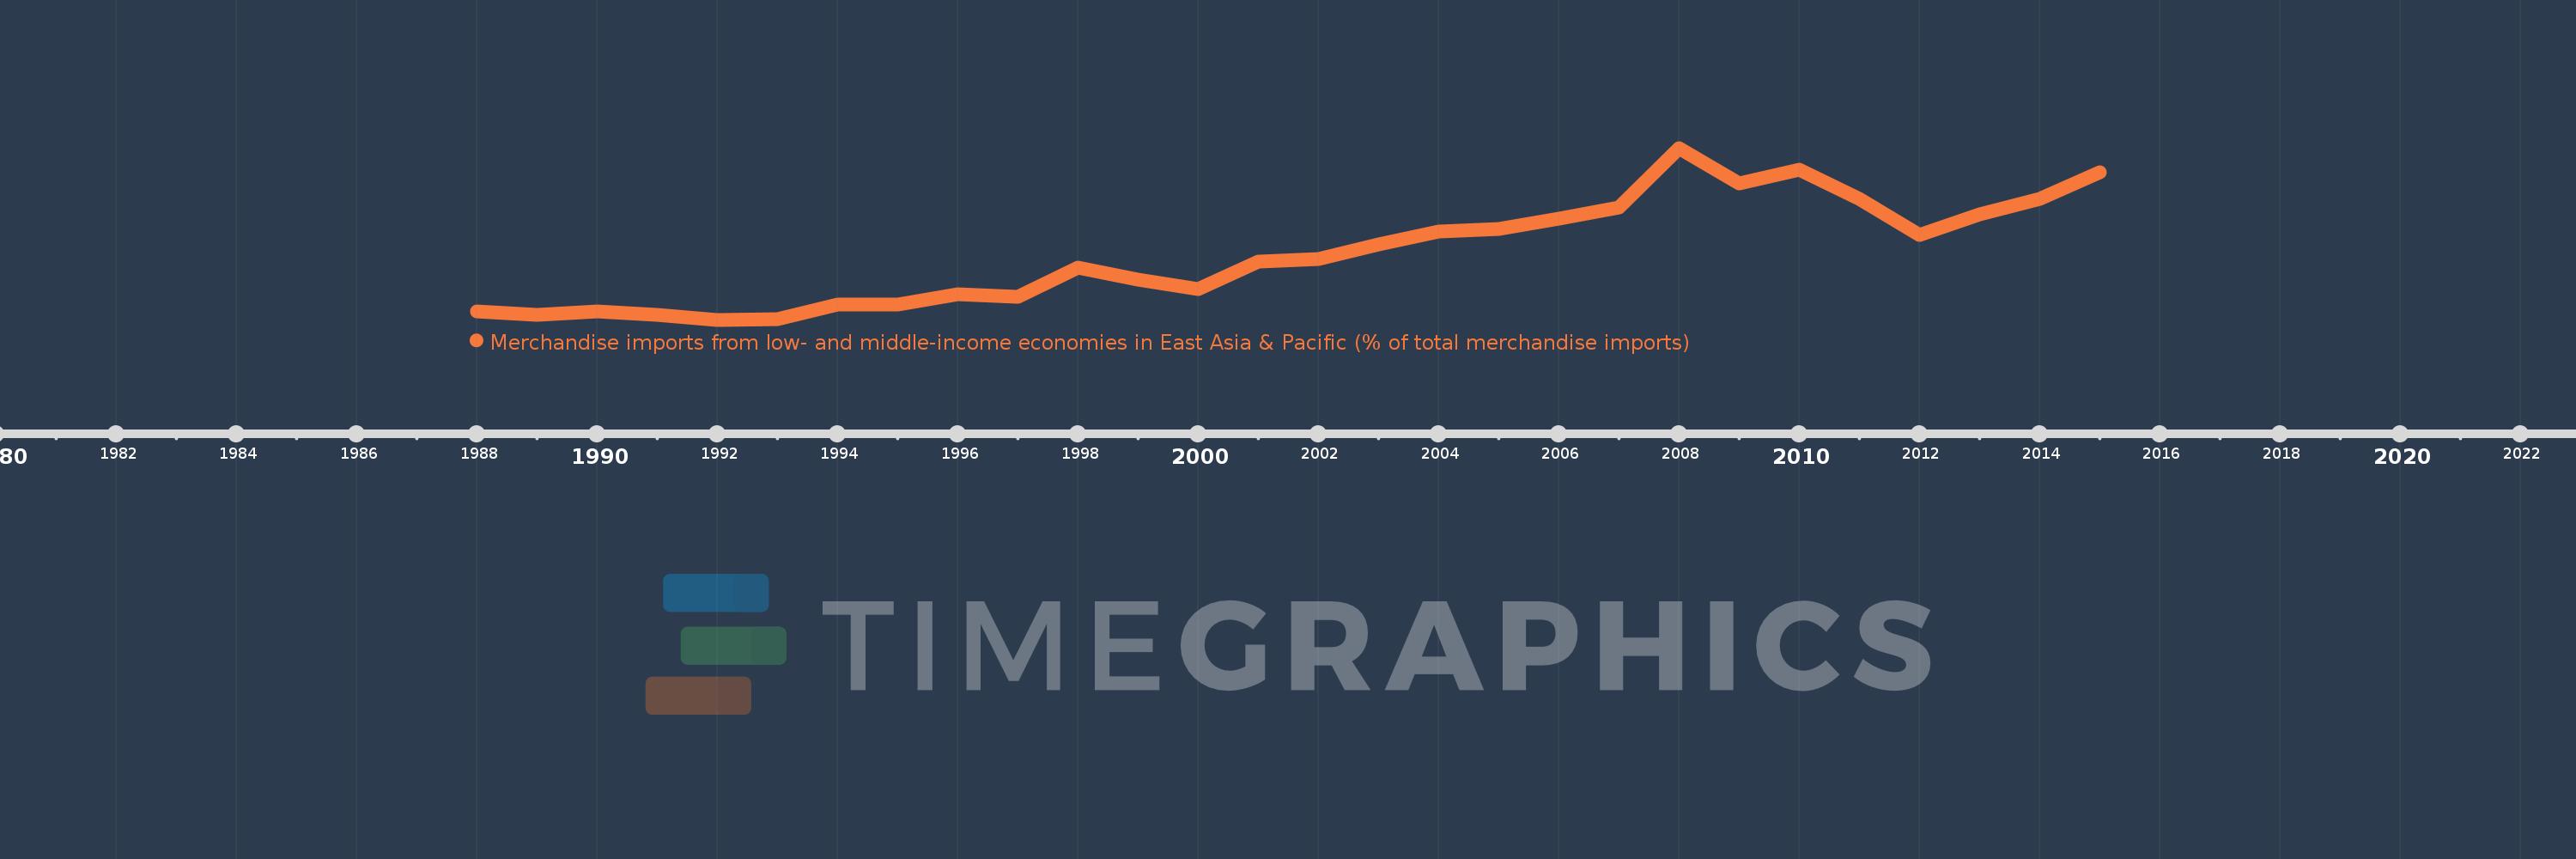
Merchandise imports from low- and middle-income economies in East Asia & Pacific (% of total merchandise imports)
2015,2014,2013,2012,2011,2010,2009,2008,2007,2006,2005,2004,2003,2002,2001,2000,1999,1998,1997,1996,1995,1994,1993,1992,1991,1990,1989,1988
This statistics in other country:
AfghanistanAlbaniaAlgeriaArab WorldArgentinaArmeniaArubaAustraliaAustriaAzerbaijanBahamas, TheBahrainBangladeshBarbadosBelarusBelgiumBelizeBeninBermudaBoliviaBrazilBrunei DarussalamBulgariaBurkina FasoBurundiCabo VerdeCambodiaCameroonCanadaCaribbean small statesCentral African RepublicCentral Europe and the BalticsChileChinaColombiaCongo, Rep.Costa RicaCote d'IvoireCroatiaCyprusCzech RepublicDenmarkDominicaDominican RepublicEarly-demographic dividendEast Asia & PacificEast Asia & Pacific (excluding high income)East Asia & Pacific (IDA & IBRD countries)EcuadorEgypt, Arab Rep.El SalvadorEstoniaEthiopiaEuro areaEurope & Central AsiaEurope & Central Asia (excluding high income)Europe & Central Asia (IDA & IBRD countries)European UnionFijiFinlandFragile and conflict affected situationsFranceFrench PolynesiaGabonGambia, TheGeorgiaGermanyGhanaGreeceGreenlandGrenadaGuatemalaHaitiHeavily indebted poor countries (HIPC)High incomeHondurasHong Kong SAR, ChinaHungaryIBRD onlyIcelandIDA & IBRD totalIDA blendIDA onlyIDA totalIndiaIndonesiaIran, Islamic Rep.IraqIrelandIsraelItalyJamaicaJapanJordanKazakhstanKenyaKorea, Dem. People’s Rep.Korea, Rep.KuwaitKyrgyz RepublicLao PDRLate-demographic dividendLatin America & Caribbean Latin America & Caribbean (excluding high income)Latin America & the Caribbean (IDA & IBRD countries)LatviaLeast developed countries: UN classificationLebanonLithuaniaLow & middle incomeLow incomeLower middle incomeLuxembourgMacao SAR, ChinaMacedonia, FYRMadagascarMalaysiaMaliMaltaMauritiusMexicoMiddle East & North AfricaMiddle East & North Africa (excluding high income)Middle East & North Africa (IDA & IBRD countries)Middle incomeMoldovaMongoliaMontenegroMoroccoMyanmarNetherlandsNew CaledoniaNew ZealandNicaraguaNigerNigeriaNorth AmericaNorwayOECD membersOmanOther small statesPacific island small statesPakistanPanamaPapua New GuineaParaguayPeruPhilippinesPolandPortugalPost-demographic dividendPre-demographic dividendQatarRomaniaRussian FederationSamoaSaudi ArabiaSenegalSerbiaSingaporeSlovak RepublicSloveniaSmall statesSolomon IslandsSomaliaSouth AfricaSouth AsiaSouth Asia (IDA & IBRD)SpainSri LankaSt. Kitts and NevisSt. LuciaSt. Vincent and the GrenadinesSub-Saharan Africa Sub-Saharan Africa (excluding high income)Sub-Saharan Africa (IDA & IBRD countries)SurinameSwedenSwitzerlandTanzaniaThailandTogoTongaTrinidad and TobagoTunisiaTurkeyUgandaUkraineUnited Arab EmiratesUnited KingdomUnited StatesUpper middle incomeUruguayVanuatuVenezuela, RBVietnamWorldYemen, Rep.ZambiaZimbabwe Timeline:
This timeline shows a graph from 1988 to 2015 of Ethiopia. No data until 1987. Number of actual observations by date: 28.
Source name:
World Development Indicators
Source organization:
World Bank staff estimates based data from International Monetary Fund's Direction of Trade database.
Categories, topics:
Private Sector, Trade
Last updated:
apr 23, 2017
Indicators value changes by year
Maximum:
23.764
jan 1, 2008
At the date of observation
Value
Absolute change
Change from previous value
jan 1, 1988
1.644
+1.644
0.0%
jan 1, 1989
1.19
-0.454
-27.6%
jan 1, 1990
1.66
+0.469
39.45%
jan 1, 1991
1.177
-0.483
-29.11%
jan 1, 1992
0.542
-0.635
-53.97%
jan 1, 1993
0.648
+0.107
19.75%
jan 1, 1994
2.613
+1.965
302.99%
jan 1, 1995
2.546
-0.067
-2.56%
jan 1, 1996
3.949
+1.403
55.1%
jan 1, 1997
3.594
-0.355
-8.99%
jan 1, 1998
7.639
+4.045
112.53%
jan 1, 1999
5.979
-1.66
-21.73%
jan 1, 2000
4.729
-1.25
-20.91%
jan 1, 2001
8.448
+3.72
78.66%
jan 1, 2002
8.797
+0.348
4.12%
jan 1, 2003
10.751
+1.954
22.21%
jan 1, 2004
12.44
+1.689
15.71%
jan 1, 2005
12.815
+0.375
3.02%
jan 1, 2006
14.224
+1.408
10.99%
jan 1, 2007
15.738
+1.514
10.64%
jan 1, 2008
23.764
+8.026
51.0%
jan 1, 2009
19.014
-4.75
-19.99%
jan 1, 2010
20.808
+1.795
9.44%
jan 1, 2011
16.826
-3.982
-19.14%
jan 1, 2012
11.946
-4.88
-29.0%
jan 1, 2013
14.804
+2.858
23.92%
jan 1, 2014
16.899
+2.095
14.15%
jan 1, 2015
20.476
+3.577
21.17%
Ranking of countries by current statistics by years


Comments: