29
/
en
AIzaSyAYiBZKx7MnpbEhh9jyipgxe19OcubqV5w
April 1, 2024
161734
Italy
ITA
true
2
1
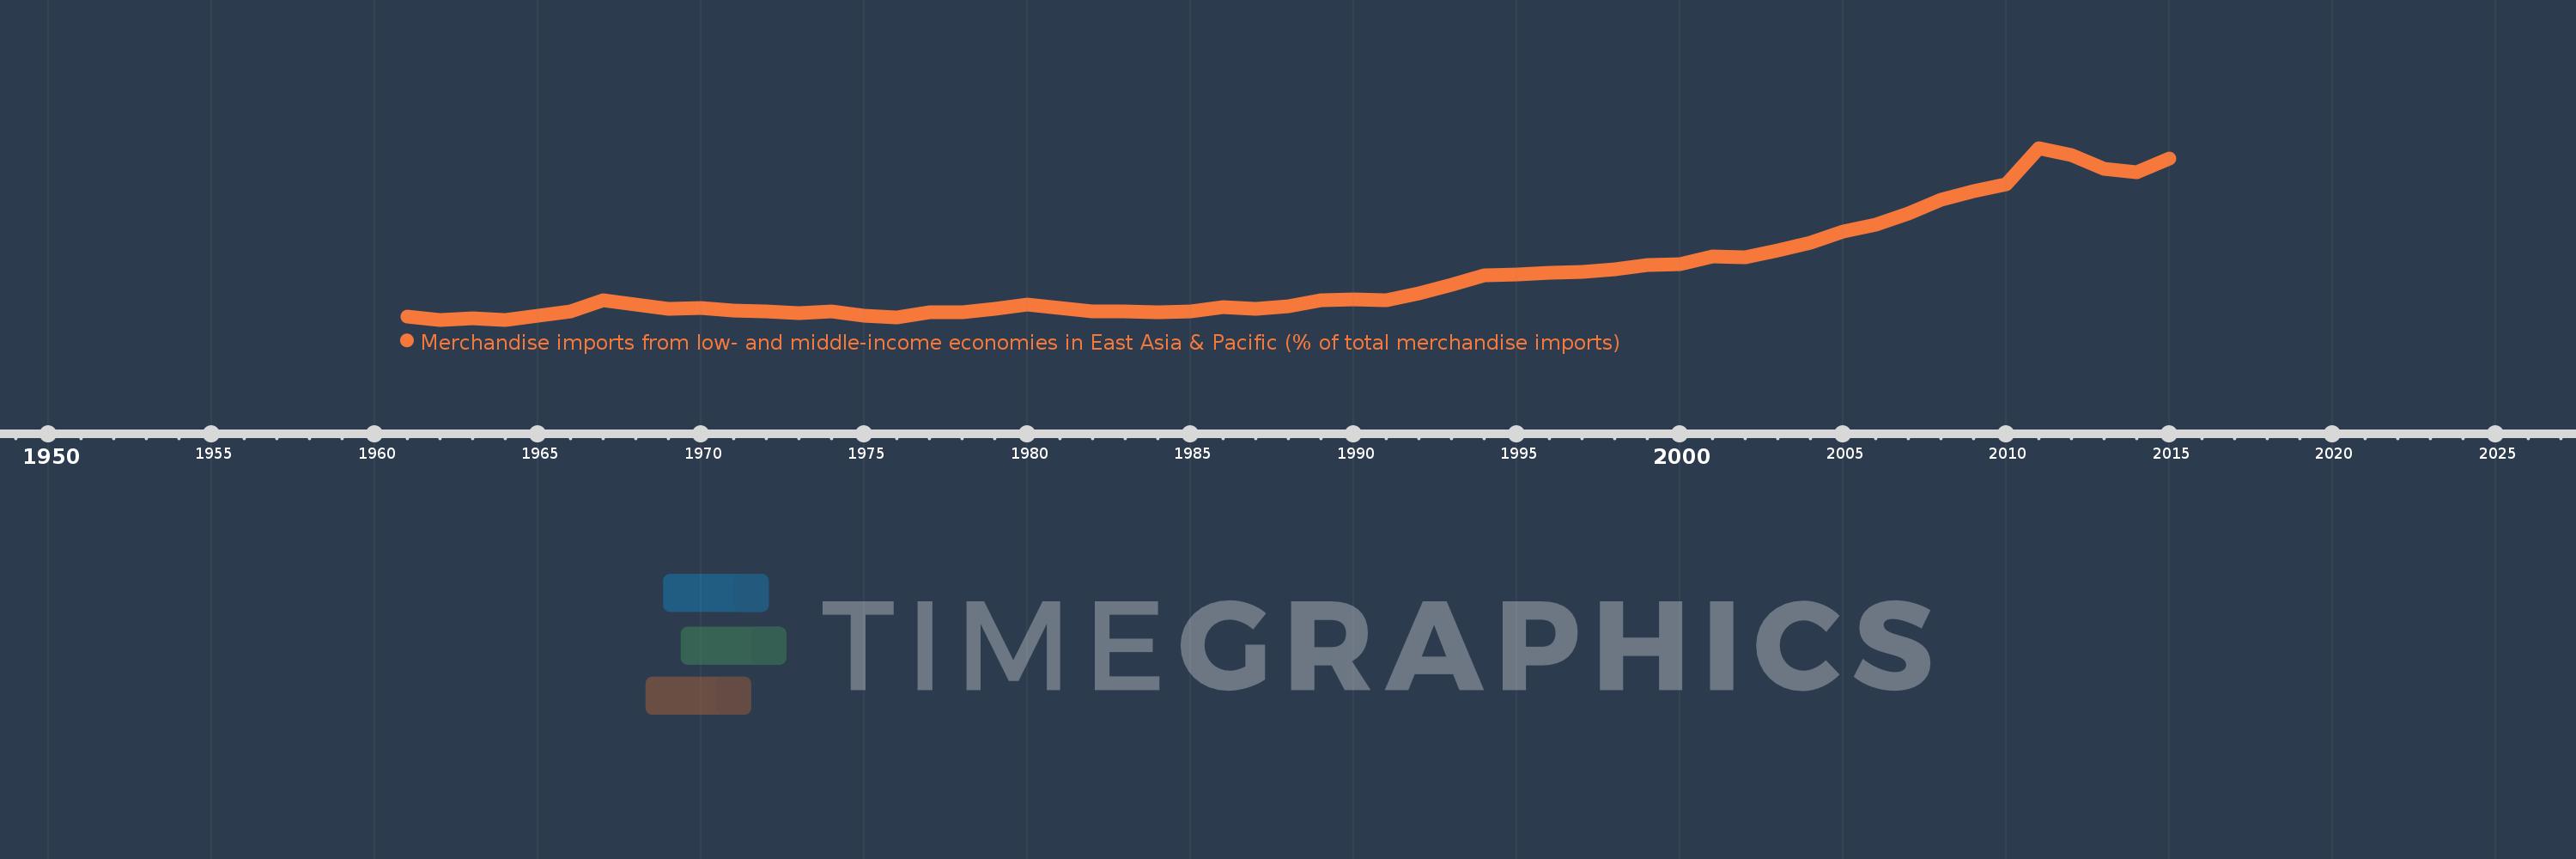
Merchandise imports from low- and middle-income economies in East Asia & Pacific (% of total merchandise imports)
2015,2014,2013,2012,2011,2010,2009,2008,2007,2006,2005,2004,2003,2002,2001,2000,1999,1998,1997,1996,1995,1994,1993,1992,1991,1990,1989,1988,1987,1986,1985,1984,1983,1982,1981,1980,1979,1978,1977,1976,1975,1974,1973,1972,1971,1970,1969,1968,1967,1966,1965,1964,1963,1962,1961
This statistics in other country:
AfghanistanAlbaniaAlgeriaArab WorldArgentinaArmeniaArubaAustraliaAustriaAzerbaijanBahamas, TheBahrainBangladeshBarbadosBelarusBelgiumBelizeBeninBermudaBoliviaBrazilBrunei DarussalamBulgariaBurkina FasoBurundiCabo VerdeCambodiaCameroonCanadaCaribbean small statesCentral African RepublicCentral Europe and the BalticsChileChinaColombiaCongo, Rep.Costa RicaCote d'IvoireCroatiaCyprusCzech RepublicDenmarkDominicaDominican RepublicEarly-demographic dividendEast Asia & PacificEast Asia & Pacific (excluding high income)East Asia & Pacific (IDA & IBRD countries)EcuadorEgypt, Arab Rep.El SalvadorEstoniaEthiopiaEuro areaEurope & Central AsiaEurope & Central Asia (excluding high income)Europe & Central Asia (IDA & IBRD countries)European UnionFijiFinlandFragile and conflict affected situationsFranceFrench PolynesiaGabonGambia, TheGeorgiaGermanyGhanaGreeceGreenlandGrenadaGuatemalaHaitiHeavily indebted poor countries (HIPC)High incomeHondurasHong Kong SAR, ChinaHungaryIBRD onlyIcelandIDA & IBRD totalIDA blendIDA onlyIDA totalIndiaIndonesiaIran, Islamic Rep.IraqIrelandIsraelItalyJamaicaJapanJordanKazakhstanKenyaKorea, Dem. People’s Rep.Korea, Rep.KuwaitKyrgyz RepublicLao PDRLate-demographic dividendLatin America & Caribbean Latin America & Caribbean (excluding high income)Latin America & the Caribbean (IDA & IBRD countries)LatviaLeast developed countries: UN classificationLebanonLithuaniaLow & middle incomeLow incomeLower middle incomeLuxembourgMacao SAR, ChinaMacedonia, FYRMadagascarMalaysiaMaliMaltaMauritiusMexicoMiddle East & North AfricaMiddle East & North Africa (excluding high income)Middle East & North Africa (IDA & IBRD countries)Middle incomeMoldovaMongoliaMontenegroMoroccoMyanmarNetherlandsNew CaledoniaNew ZealandNicaraguaNigerNigeriaNorth AmericaNorwayOECD membersOmanOther small statesPacific island small statesPakistanPanamaPapua New GuineaParaguayPeruPhilippinesPolandPortugalPost-demographic dividendPre-demographic dividendQatarRomaniaRussian FederationSamoaSaudi ArabiaSenegalSerbiaSingaporeSlovak RepublicSloveniaSmall statesSolomon IslandsSomaliaSouth AfricaSouth AsiaSouth Asia (IDA & IBRD)SpainSri LankaSt. Kitts and NevisSt. LuciaSt. Vincent and the GrenadinesSub-Saharan Africa Sub-Saharan Africa (excluding high income)Sub-Saharan Africa (IDA & IBRD countries)SurinameSwedenSwitzerlandTanzaniaThailandTogoTongaTrinidad and TobagoTunisiaTurkeyUgandaUkraineUnited Arab EmiratesUnited KingdomUnited StatesUpper middle incomeUruguayVanuatuVenezuela, RBVietnamWorldYemen, Rep.ZambiaZimbabwe Timeline:
This timeline shows a graph from 1961 to 2015 of Italy. No data until 1960. Number of actual observations by date: 55.
Source name:
World Development Indicators
Source organization:
World Bank staff estimates based data from International Monetary Fund's Direction of Trade database.
Categories, topics:
Private Sector, Trade
Last updated:
apr 23, 2017
Indicators value changes by year
At the date of observation
Value
Absolute change
Change from previous value
jan 1, 1961
0.925
+0.925
0.0%
jan 1, 1962
0.745
-0.181
-19.51%
jan 1, 1963
0.819
+0.075
10.03%
jan 1, 1964
0.738
-0.082
-9.96%
jan 1, 1965
0.971
+0.233
31.54%
jan 1, 1966
1.186
+0.215
22.15%
jan 1, 1967
1.774
+0.588
49.6%
jan 1, 1968
1.536
-0.238
-13.41%
jan 1, 1969
1.326
-0.21
-13.67%
jan 1, 1970
1.38
+0.054
4.11%
jan 1, 1971
1.227
-0.153
-11.11%
jan 1, 1972
1.176
-0.051
-4.12%
jan 1, 1973
1.107
-0.069
-5.89%
jan 1, 1974
1.174
+0.067
6.04%
jan 1, 1975
0.97
-0.204
-17.4%
jan 1, 1976
0.842
-0.128
-13.18%
jan 1, 1977
1.129
+0.287
34.07%
jan 1, 1978
1.115
-0.014
-1.25%
jan 1, 1979
1.328
+0.214
19.18%
jan 1, 1980
1.535
+0.207
15.56%
jan 1, 1981
1.375
-0.16
-10.41%
jan 1, 1982
1.199
-0.176
-12.79%
jan 1, 1983
1.191
-0.009
-0.71%
jan 1, 1984
1.133
-0.058
-4.84%
jan 1, 1985
1.174
+0.041
3.63%
jan 1, 1986
1.389
+0.214
18.24%
jan 1, 1987
1.318
-0.071
-5.1%
jan 1, 1988
1.478
+0.16
12.12%
jan 1, 1989
1.764
+0.286
19.38%
jan 1, 1990
1.842
+0.078
4.42%
jan 1, 1991
1.762
-0.08
-4.35%
jan 1, 1992
2.159
+0.397
22.56%
jan 1, 1993
2.582
+0.422
19.56%
jan 1, 1994
3.114
+0.532
20.61%
jan 1, 1995
3.154
+0.04
1.28%
jan 1, 1996
3.224
+0.071
2.24%
jan 1, 1997
3.273
+0.049
1.51%
jan 1, 1998
3.416
+0.143
4.36%
jan 1, 1999
3.677
+0.262
7.67%
jan 1, 2000
3.702
+0.024
0.66%
jan 1, 2001
4.107
+0.405
10.95%
jan 1, 2002
4.086
-0.021
-0.5%
jan 1, 2003
4.446
+0.36
8.8%
jan 1, 2004
4.857
+0.411
9.24%
jan 1, 2005
5.435
+0.578
11.9%
jan 1, 2006
5.794
+0.359
6.61%
jan 1, 2007
6.396
+0.602
10.38%
jan 1, 2008
7.128
+0.733
11.45%
jan 1, 2009
7.594
+0.466
6.54%
jan 1, 2010
7.936
+0.342
4.5%
jan 1, 2011
9.895
+1.959
24.68%
jan 1, 2012
9.529
-0.366
-3.7%
jan 1, 2013
8.785
-0.744
-7.81%
jan 1, 2014
8.581
-0.204
-2.32%
jan 1, 2015
9.324
+0.743
8.66%
Ranking of countries by current statistics by years


Comments: