29
/
en
AIzaSyAYiBZKx7MnpbEhh9jyipgxe19OcubqV5w
April 1, 2024
160742
Israel
ISR
true
2
1
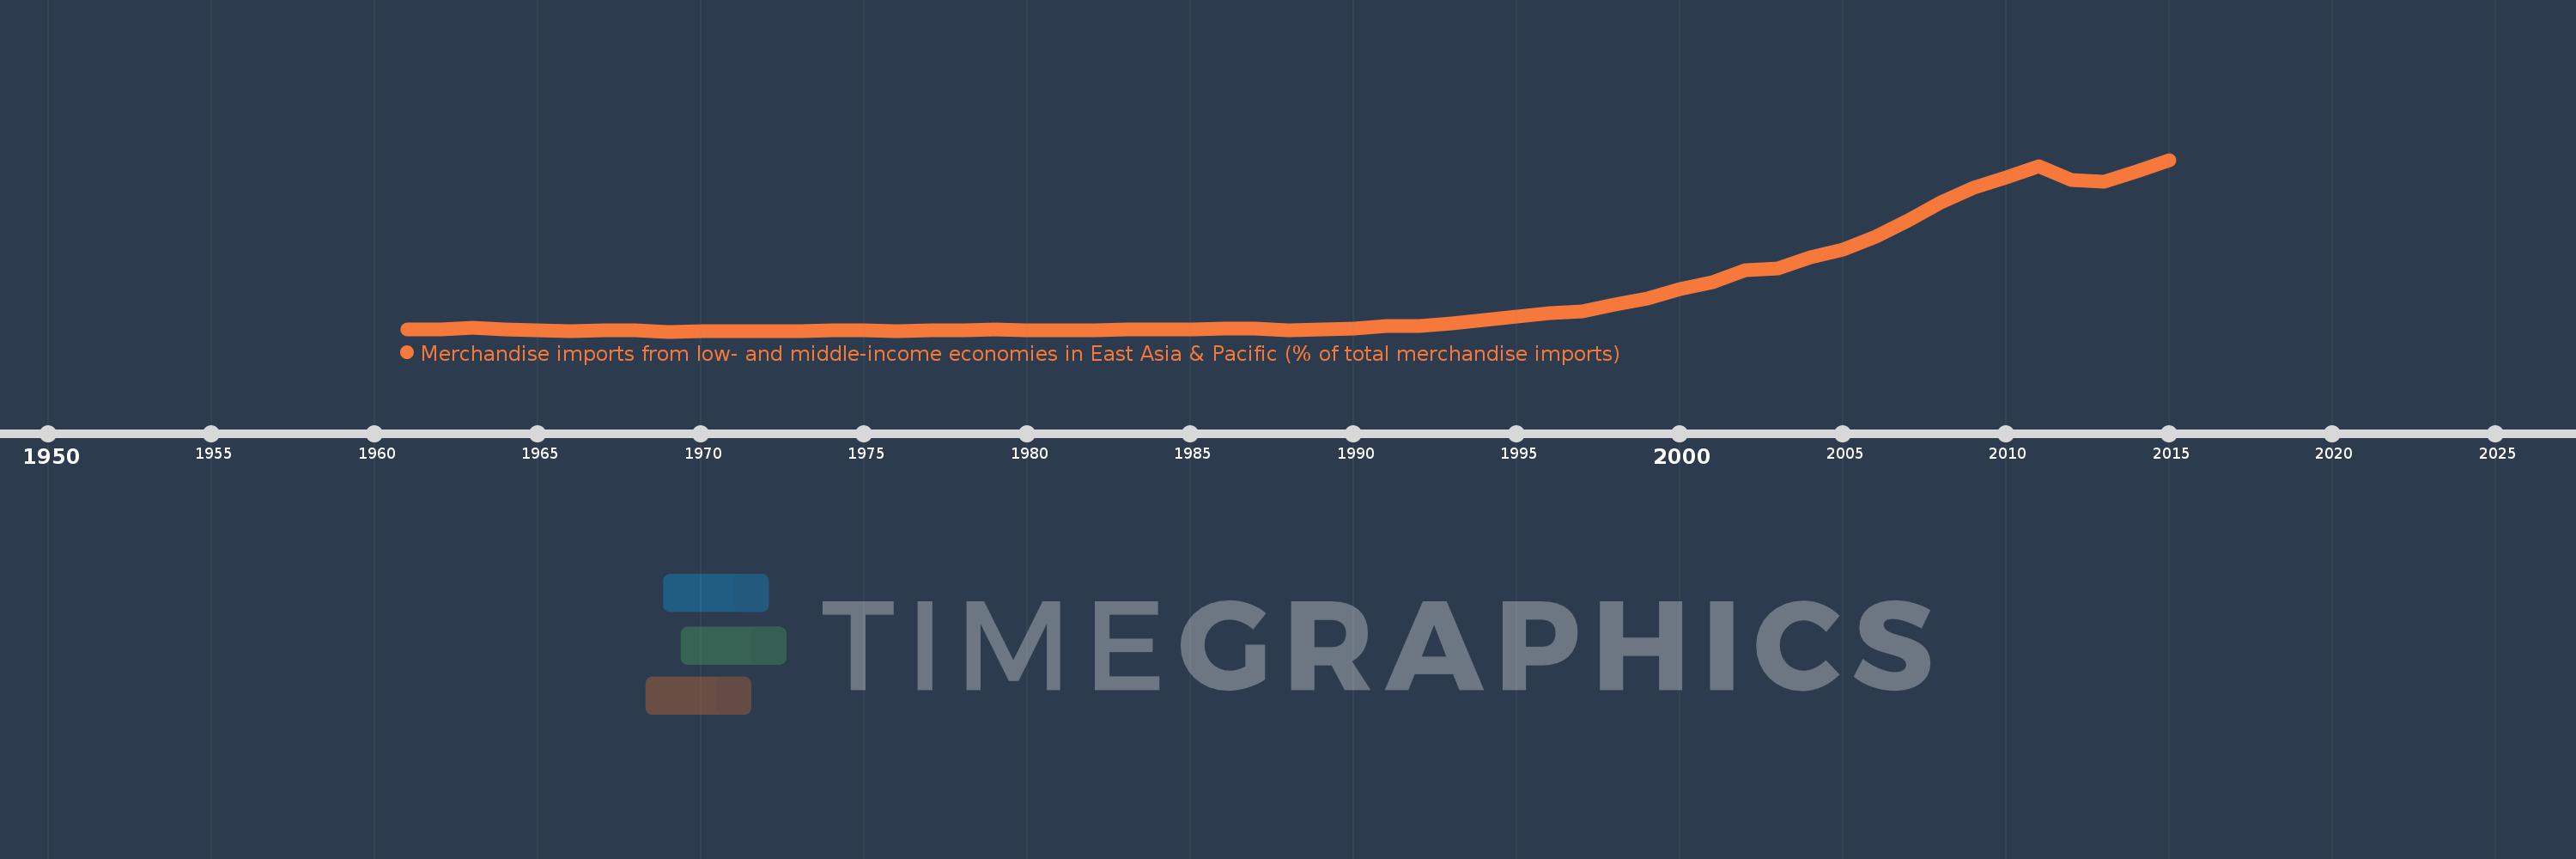
Merchandise imports from low- and middle-income economies in East Asia & Pacific (% of total merchandise imports)
2015,2014,2013,2012,2011,2010,2009,2008,2007,2006,2005,2004,2003,2002,2001,2000,1999,1998,1997,1996,1995,1994,1993,1992,1991,1990,1989,1988,1987,1986,1985,1984,1983,1982,1981,1980,1979,1978,1977,1976,1975,1974,1973,1972,1971,1970,1969,1968,1967,1966,1965,1964,1963,1962,1961
This statistics in other country:
AfghanistanAlbaniaAlgeriaArab WorldArgentinaArmeniaArubaAustraliaAustriaAzerbaijanBahamas, TheBahrainBangladeshBarbadosBelarusBelgiumBelizeBeninBermudaBoliviaBrazilBrunei DarussalamBulgariaBurkina FasoBurundiCabo VerdeCambodiaCameroonCanadaCaribbean small statesCentral African RepublicCentral Europe and the BalticsChileChinaColombiaCongo, Rep.Costa RicaCote d'IvoireCroatiaCyprusCzech RepublicDenmarkDominicaDominican RepublicEarly-demographic dividendEast Asia & PacificEast Asia & Pacific (excluding high income)East Asia & Pacific (IDA & IBRD countries)EcuadorEgypt, Arab Rep.El SalvadorEstoniaEthiopiaEuro areaEurope & Central AsiaEurope & Central Asia (excluding high income)Europe & Central Asia (IDA & IBRD countries)European UnionFijiFinlandFragile and conflict affected situationsFranceFrench PolynesiaGabonGambia, TheGeorgiaGermanyGhanaGreeceGreenlandGrenadaGuatemalaHaitiHeavily indebted poor countries (HIPC)High incomeHondurasHong Kong SAR, ChinaHungaryIBRD onlyIcelandIDA & IBRD totalIDA blendIDA onlyIDA totalIndiaIndonesiaIran, Islamic Rep.IraqIrelandIsraelItalyJamaicaJapanJordanKazakhstanKenyaKorea, Dem. People’s Rep.Korea, Rep.KuwaitKyrgyz RepublicLao PDRLate-demographic dividendLatin America & Caribbean Latin America & Caribbean (excluding high income)Latin America & the Caribbean (IDA & IBRD countries)LatviaLeast developed countries: UN classificationLebanonLithuaniaLow & middle incomeLow incomeLower middle incomeLuxembourgMacao SAR, ChinaMacedonia, FYRMadagascarMalaysiaMaliMaltaMauritiusMexicoMiddle East & North AfricaMiddle East & North Africa (excluding high income)Middle East & North Africa (IDA & IBRD countries)Middle incomeMoldovaMongoliaMontenegroMoroccoMyanmarNetherlandsNew CaledoniaNew ZealandNicaraguaNigerNigeriaNorth AmericaNorwayOECD membersOmanOther small statesPacific island small statesPakistanPanamaPapua New GuineaParaguayPeruPhilippinesPolandPortugalPost-demographic dividendPre-demographic dividendQatarRomaniaRussian FederationSamoaSaudi ArabiaSenegalSerbiaSingaporeSlovak RepublicSloveniaSmall statesSolomon IslandsSomaliaSouth AfricaSouth AsiaSouth Asia (IDA & IBRD)SpainSri LankaSt. Kitts and NevisSt. LuciaSt. Vincent and the GrenadinesSub-Saharan Africa Sub-Saharan Africa (excluding high income)Sub-Saharan Africa (IDA & IBRD countries)SurinameSwedenSwitzerlandTanzaniaThailandTogoTongaTrinidad and TobagoTunisiaTurkeyUgandaUkraineUnited Arab EmiratesUnited KingdomUnited StatesUpper middle incomeUruguayVanuatuVenezuela, RBVietnamWorldYemen, Rep.ZambiaZimbabwe Timeline:
This timeline shows a graph from 1961 to 2015 of Israel. No data until 1960. Number of actual observations by date: 55.
Source name:
World Development Indicators
Source organization:
World Bank staff estimates based data from International Monetary Fund's Direction of Trade database.
Categories, topics:
Private Sector, Trade
Last updated:
apr 23, 2017
Indicators value changes by year
At the date of observation
Value
Absolute change
Change from previous value
jan 1, 1961
0.141
+0.141
0.0%
jan 1, 1962
0.14
-0.001
-0.93%
jan 1, 1963
0.221
+0.081
57.75%
jan 1, 1964
0.119
-0.102
-46.16%
jan 1, 1965
0.108
-0.011
-9.01%
jan 1, 1966
0.036
-0.072
-66.67%
jan 1, 1967
0.072
+0.036
98.74%
jan 1, 1968
0.08
+0.008
11.13%
jan 1, 1969
0.009
-0.07
-88.35%
jan 1, 1970
0.041
+0.032
346.96%
jan 1, 1971
0.049
+0.007
17.28%
jan 1, 1972
0.034
-0.014
-29.31%
jan 1, 1973
0.031
-0.003
-9.28%
jan 1, 1974
0.101
+0.07
224.08%
jan 1, 1975
0.076
-0.025
-24.43%
jan 1, 1976
0.042
-0.034
-45.15%
jan 1, 1977
0.105
+0.063
151.7%
jan 1, 1978
0.079
-0.027
-25.18%
jan 1, 1979
0.128
+0.049
61.84%
jan 1, 1980
0.106
-0.022
-17.02%
jan 1, 1981
0.083
-0.023
-21.94%
jan 1, 1982
0.086
+0.004
4.54%
jan 1, 1983
0.114
+0.028
32.17%
jan 1, 1984
0.156
+0.042
37.03%
jan 1, 1985
0.126
-0.031
-19.74%
jan 1, 1986
0.199
+0.073
58.39%
jan 1, 1987
0.19
-0.009
-4.61%
jan 1, 1988
0.088
-0.102
-53.69%
jan 1, 1989
0.156
+0.068
77.5%
jan 1, 1990
0.202
+0.046
29.67%
jan 1, 1991
0.332
+0.13
64.18%
jan 1, 1992
0.356
+0.024
7.32%
jan 1, 1993
0.465
+0.109
30.49%
jan 1, 1994
0.679
+0.214
46.04%
jan 1, 1995
0.892
+0.213
31.45%
jan 1, 1996
1.095
+0.203
22.7%
jan 1, 1997
1.186
+0.091
8.32%
jan 1, 1998
1.584
+0.398
33.55%
jan 1, 1999
1.93
+0.347
21.89%
jan 1, 2000
2.484
+0.553
28.67%
jan 1, 2001
2.844
+0.361
14.53%
jan 1, 2002
3.553
+0.709
24.91%
jan 1, 2003
3.67
+0.117
3.29%
jan 1, 2004
4.274
+0.605
16.48%
jan 1, 2005
4.765
+0.491
11.48%
jan 1, 2006
5.502
+0.737
15.46%
jan 1, 2007
6.412
+0.91
16.54%
jan 1, 2008
7.493
+1.081
16.86%
jan 1, 2009
8.319
+0.826
11.03%
jan 1, 2010
8.918
+0.598
7.19%
jan 1, 2011
9.536
+0.618
6.93%
jan 1, 2012
8.778
-0.758
-7.95%
jan 1, 2013
8.683
-0.095
-1.09%
jan 1, 2014
9.276
+0.594
6.84%
jan 1, 2015
9.927
+0.651
7.02%
Ranking of countries by current statistics by years


Comments: